#90DaysOfDevOps Challenge - Day 75 - Monitor Docker Containers with Grafana
Cloud Engineer and DevOps enthusiast, just talking about AWS, Docker, Linux, Kubernetes, Python, and automation.
Welcome back to the #90DaysOfDevOps Challenge. On Day 75, we'll explore how to send Docker logs to Grafana for real-time monitoring and analysis. By integrating Docker containers with Grafana, you can gain valuable insights into your containerized applications and ensure their smooth operation. Let's get started!
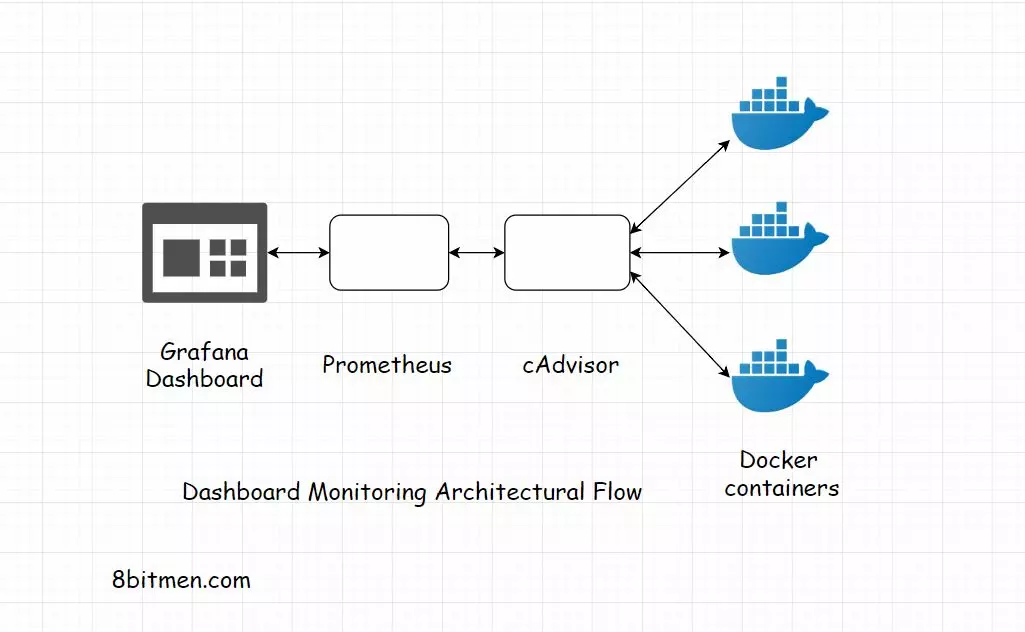
Monitoring Container Performance with cAdvisor and Prometheus
cAdvisor (Container Advisor) is an open-source tool designed for monitoring and analyzing container performance at the individual container level. It provides valuable insights into resource usage, performance metrics, and health statistics of containers running on a host or within a container orchestration platform like Kubernetes. cAdvisor enables DevOps engineers and system administrators to efficiently track the behaviour of containers, troubleshoot issues, and optimize resource allocation for better overall system performance.
Key Features of cAdvisor:
Container-Level Metrics: cAdvisor collects various metrics at the container level, including CPU usage, memory consumption, file system usage, network statistics, and more.
Real-Time Monitoring: It provides real-time monitoring of containers, allowing users to observe changes in resource utilization and performance metrics as containers operate.
Resource Utilization Analysis: cAdvisor offers comprehensive insights into the resource utilization of containers, helping identify bottlenecks and inefficiencies.
Container Health Analysis: It provides health checks and analysis for containers, indicating the overall health status of containers.
Integrating cAdvisor with Prometheus enhances container monitoring capabilities, providing valuable insights into container performance and resource utilization. By leveraging the powerful features of cAdvisor and Prometheus, DevOps teams can optimize containerized applications, troubleshoot performance issues, and ensure the overall health and efficiency of their container infrastructure.
Task: Sending Docker Logs to Grafana
Step 1: Install Docker and Start Docker Service on Ubuntu EC2 through USER Data
We'll use the below script through USER DATA to install Docker and start and enable the service.
 #!/bin/bash

 sudo apt update
 sudo apt install -y apt-transport-https ca-certificates curl software-properties-common
 curl -fsSL https://download.docker.com/linux/ubuntu/gpg | sudo gpg --dearmor -o /usr/share/keyrings/docker-archive-keyring.gpg
 echo "deb [arch=amd64 signed-by=/usr/share/keyrings/docker-archive-keyring.gpg] https://download.docker.com/linux/ubuntu $(lsb_release -cs) stable" | sudo tee /etc/apt/sources.list.d/docker.list > /dev/null
 sudo apt update
 sudo apt install -y docker-ce docker-ce-cli containerd.io
 sudo systemctl start docker
 sudo systemctl enable docker
 sudo usermod -aG docker $USER
 sudo reboot
Step 2: Create a docker-compose.yml file with all the required containers
Connect to your Ubuntu EC2 instance
I've chosen to create two containers. Code-Server, which is a containerized version of VS Code and Jenkins. The docker compose file also includes Grafana, Prometheus and cAdvisor. Create a
docker-compose.ymlfile with the following content.version: "3" volumes: prometheus-data: driver: local grafana-data: driver: local services: # Grafana service grafana: image: grafana/grafana-oss:latest container_name: grafana ports: - "3000:3000" volumes: - grafana-data:/var/lib/grafana restart: unless-stopped # Prometheus service prometheus: image: prom/prometheus:latest container_name: prometheus ports: - "9090:9090" volumes: - /etc/prometheus:/etc/prometheus - prometheus-data:/prometheus command: "--config.file=/etc/prometheus/prometheus.yml" restart: unless-stopped # Code-Server service code-server: image: lscr.io/linuxserver/code-server:latest container_name: code-server environment: - PUID=1000 - PGID=1000 - TZ=Etc/UTC volumes: - /etc/opt/docker/code-server/config:/config ports: - 8443:8443 restart: unless-stopped # Jenkins service jenkins: image: jenkins/jenkins:lts container_name: jenkins privileged: true user: root volumes: - /etc/opt/docker/jenkins/config:/var/jenkins_home - /var/run/docker.sock:/var/run/docker.sock - /usr/local/bin/docker:/usr/local/bin/docker ports: - 8081:8080 - 50000:50000 restart: unless-stopped # cAdvisor service cadvisor: image: gcr.io/cadvisor/cadvisor:v0.47.0 container_name: cadvisor ports: - 8080:8080 network_mode: host volumes: - /:/rootfs:ro - /var/run:/var/run:ro - /sys:/sys:ro - /var/lib/docker/:/var/lib/docker:ro - /dev/disk/:/dev/disk:ro devices: - /dev/kmsg privileged: true restart: unless-stoppedStart the Docker containers by running
docker compose up -d.
Step 3: Configure Prometheus to Scrap Metrics
Ensure your Ubuntu EC2 instance is connected to Grafana with the Prometheus data source configured as described in the previous article (#90DaysOfDevOps - Day 74: Connecting EC2 with Grafana).
Amend the prometheus.yml file as per the below:
 global:
   scrape_interval:     15s # By default, scrape targets every 15 seconds.

   # Attach these labels to any time series or alerts when communicating with
   # external systems (federation, remote storage, Alertmanager).
   # external_labels:
   #  monitor: 'codelab-monitor'

 # A scrape configuration containing exactly one endpoint to scrape:
 # Here it's Prometheus itself.
 scrape_configs:
   # The job name is added as a label `job=<job_name>` to any timeseries scraped from this config.
   - job_name: 'prometheus'
     # Override the global default and scrape targets from this job every 5 seconds.
     scrape_interval: 5s
     static_configs:
       - targets: ['172.31.0.36:9090']

   # Example job for node_exporter
 #  - job_name: 'node_exporter'
 #    static_configs:
 #      - targets: ['172.31.0.58:9100', '172.31.0.36:9100']

   # Example job for cadvisor
   - job_name: 'cadvisor'
     static_configs:
       - targets: ['172.31.0.36:8080']
Restart Prometheus and access its dashboard to check if it can connect to the target nodes

Access your Grafana dashboard using the public IP address or DNS name of your EC2 instance and port 3000.
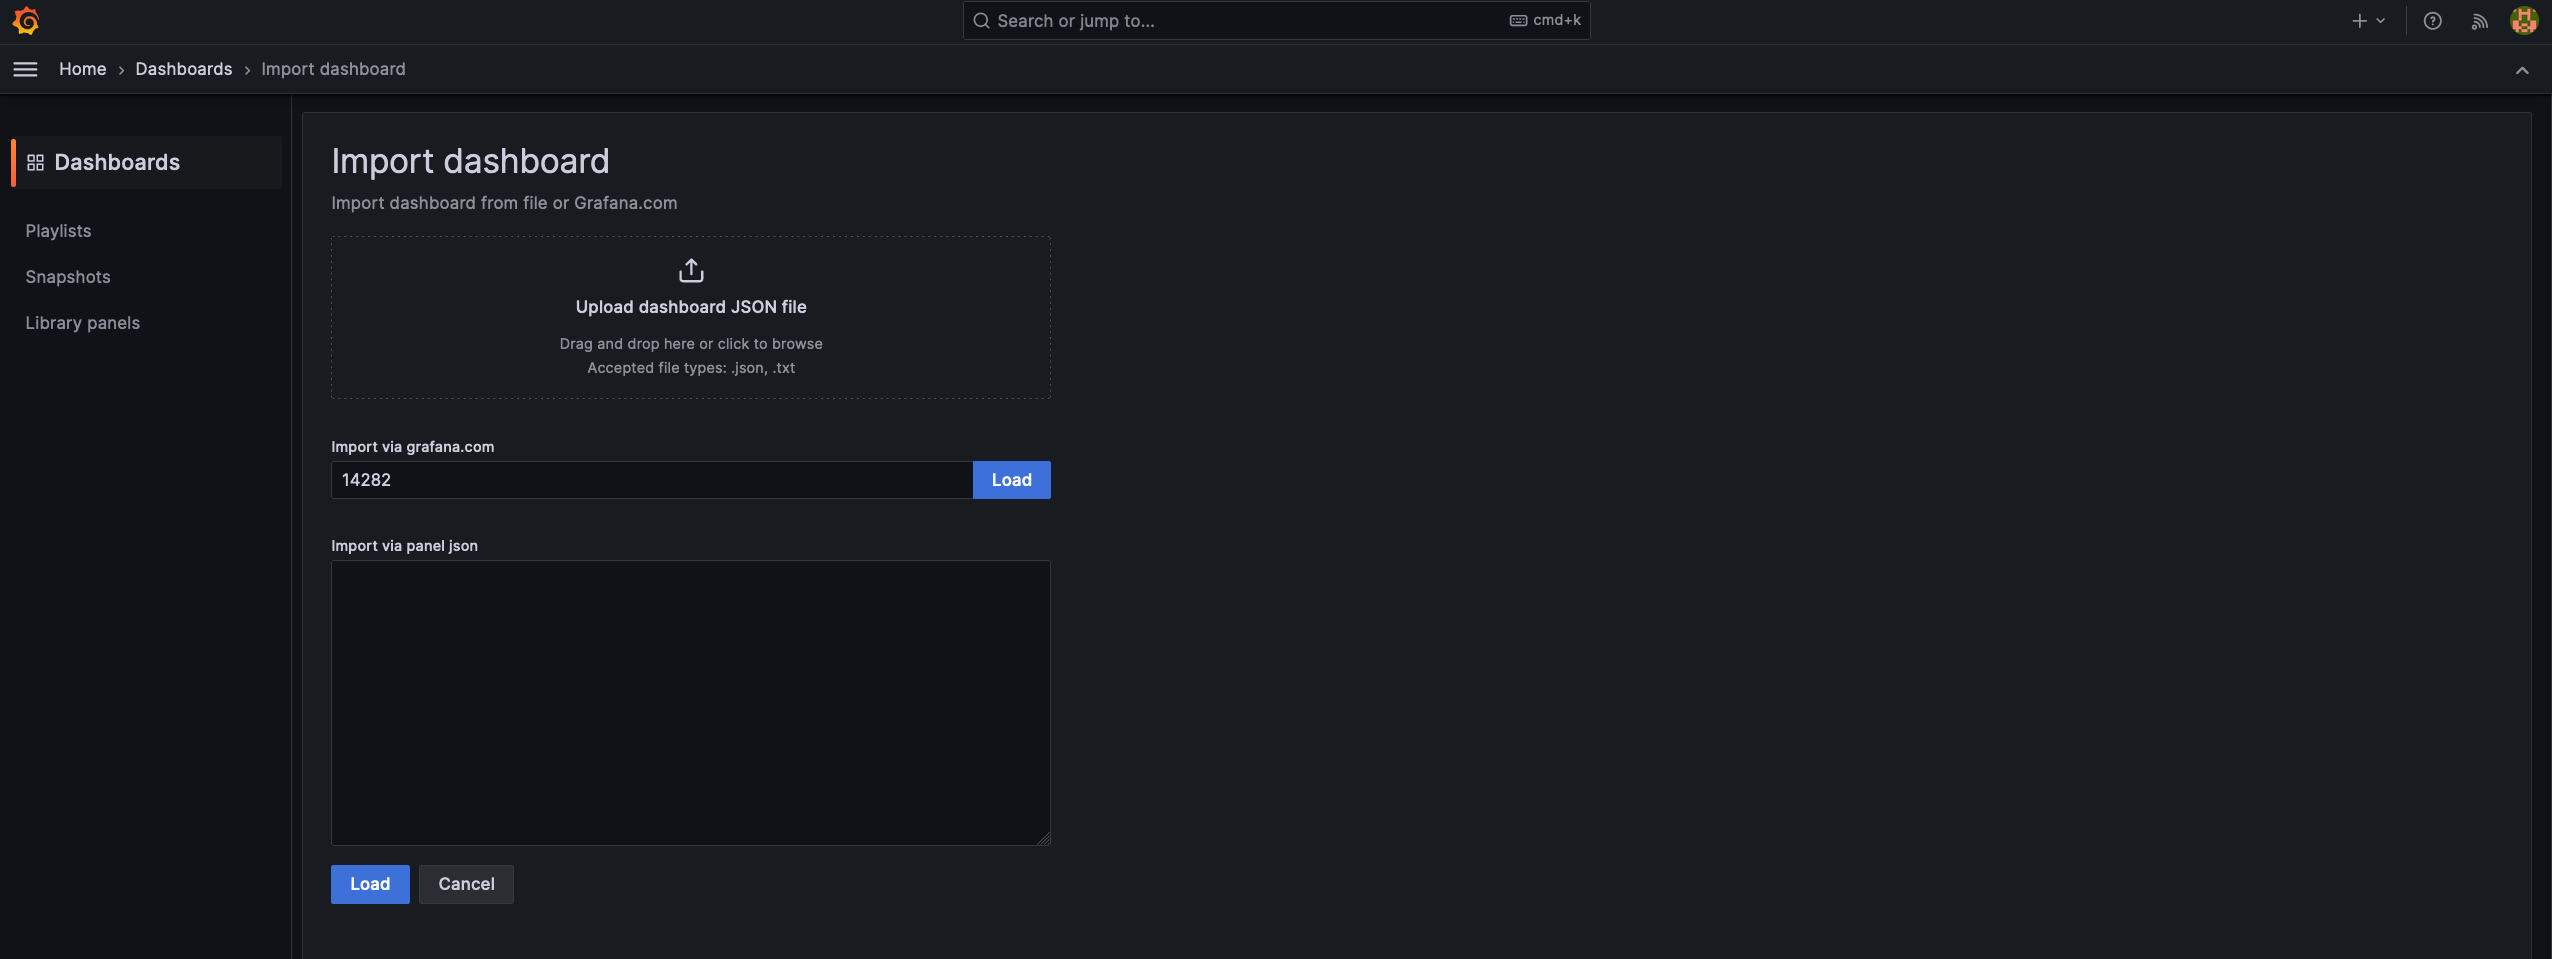
Select "Dashboards", click on the plus sign at the top of the menu and hit "import dashboard"

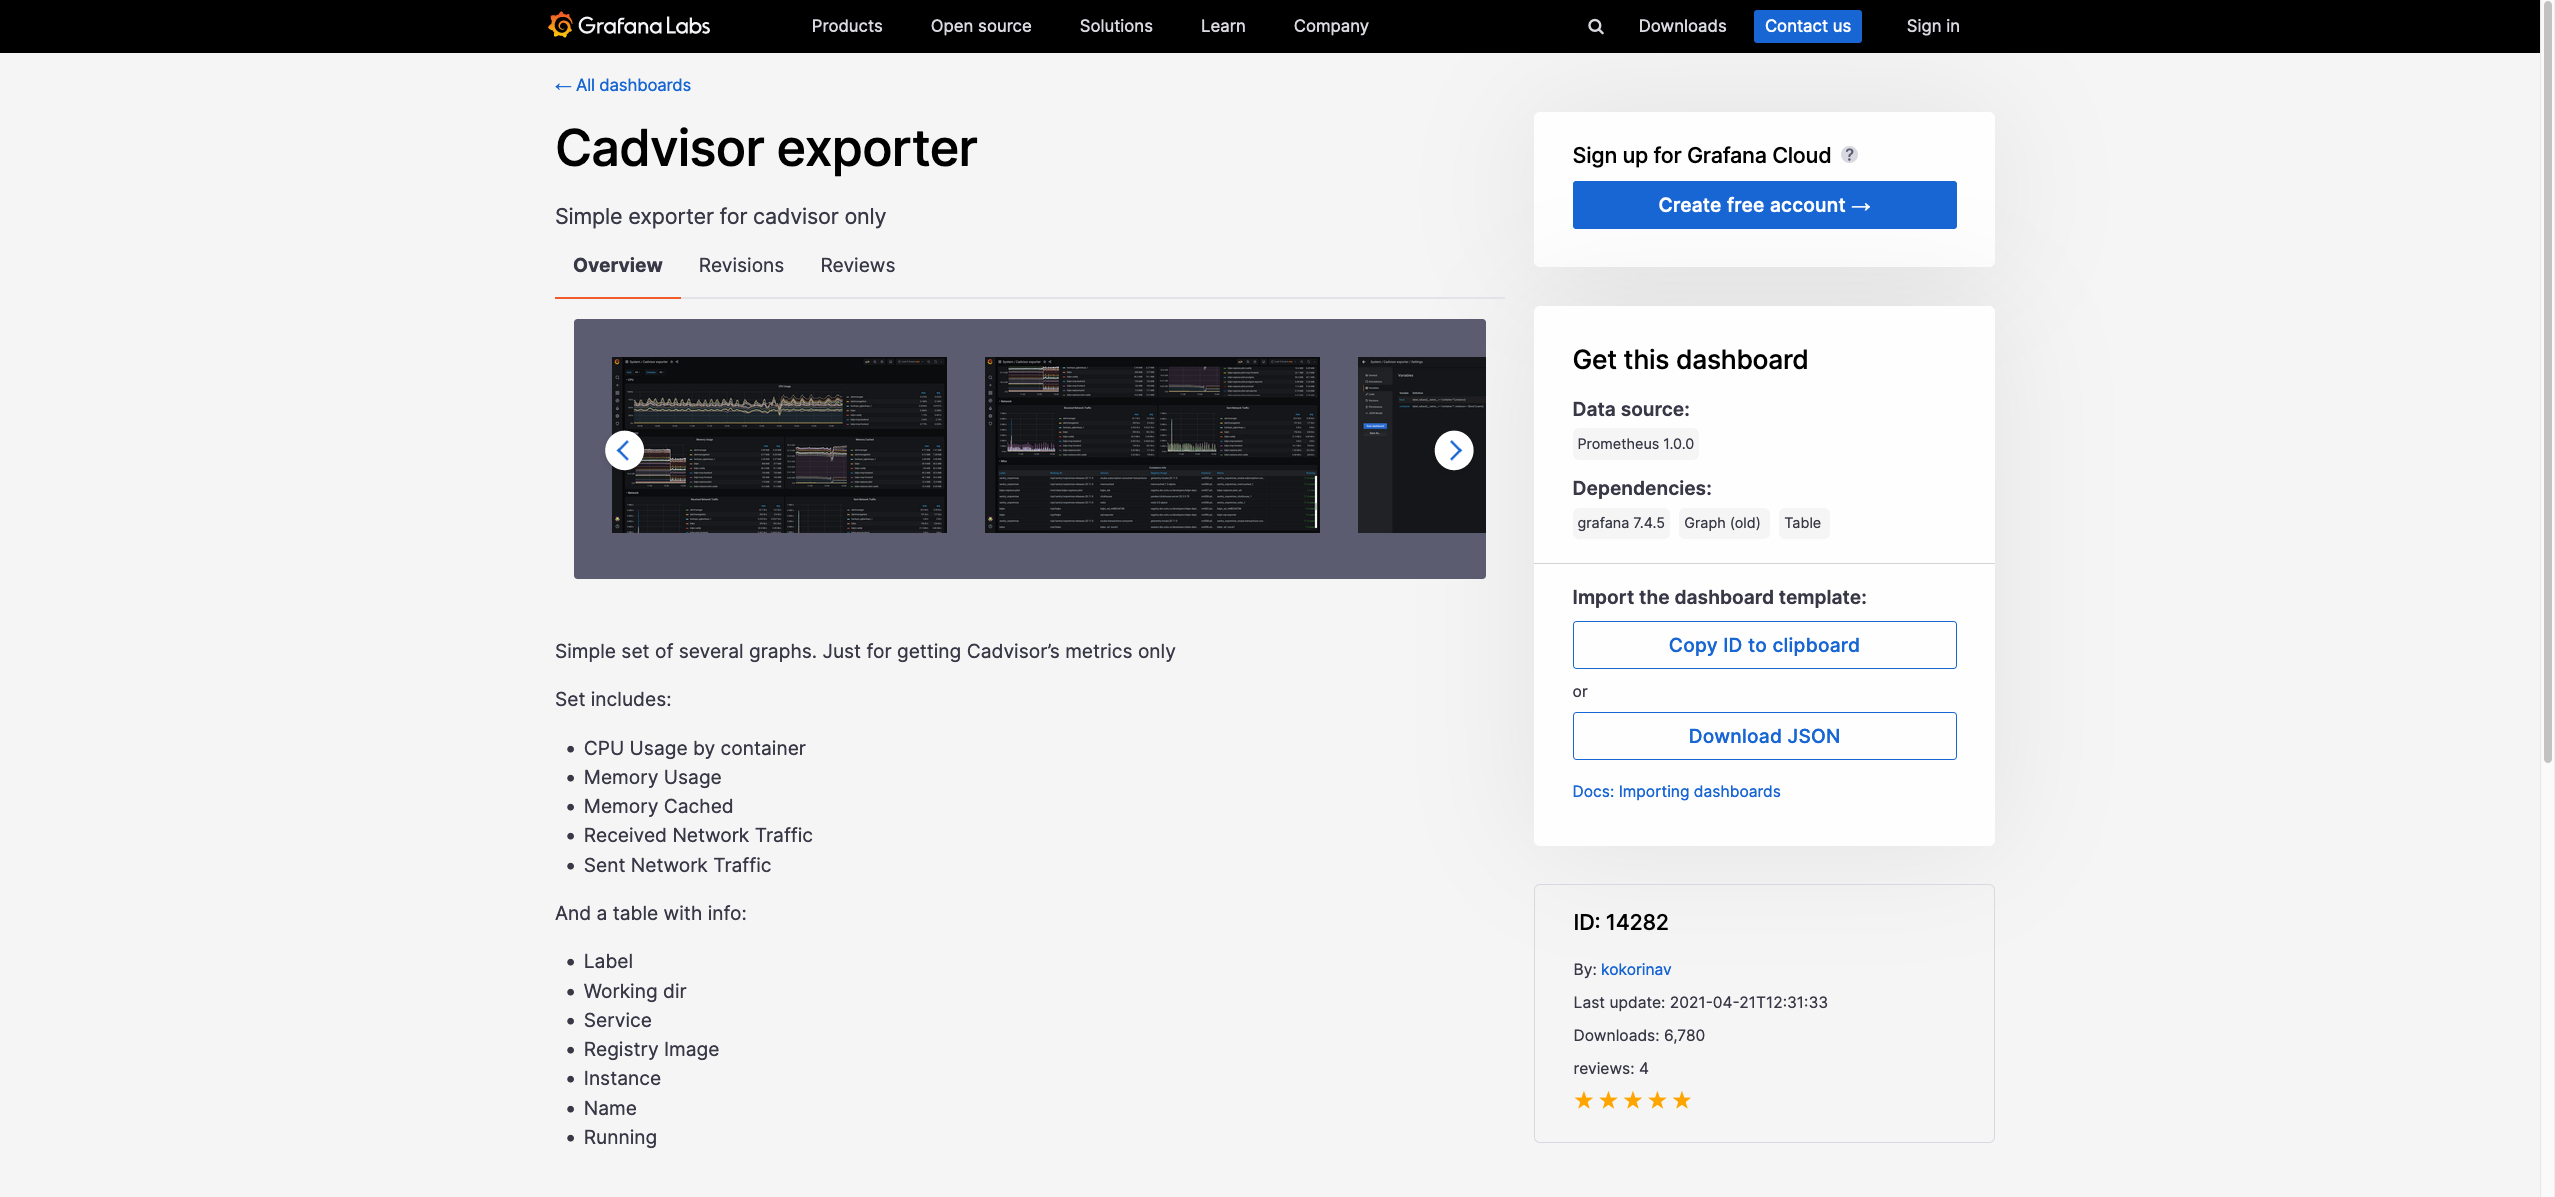
Go to the Grafana Dashboards Library and search for cAdvisor. Choose your preferred dashboard and copy the ID Number. In my case, I'll use the Cadvisor exporter dashboard.
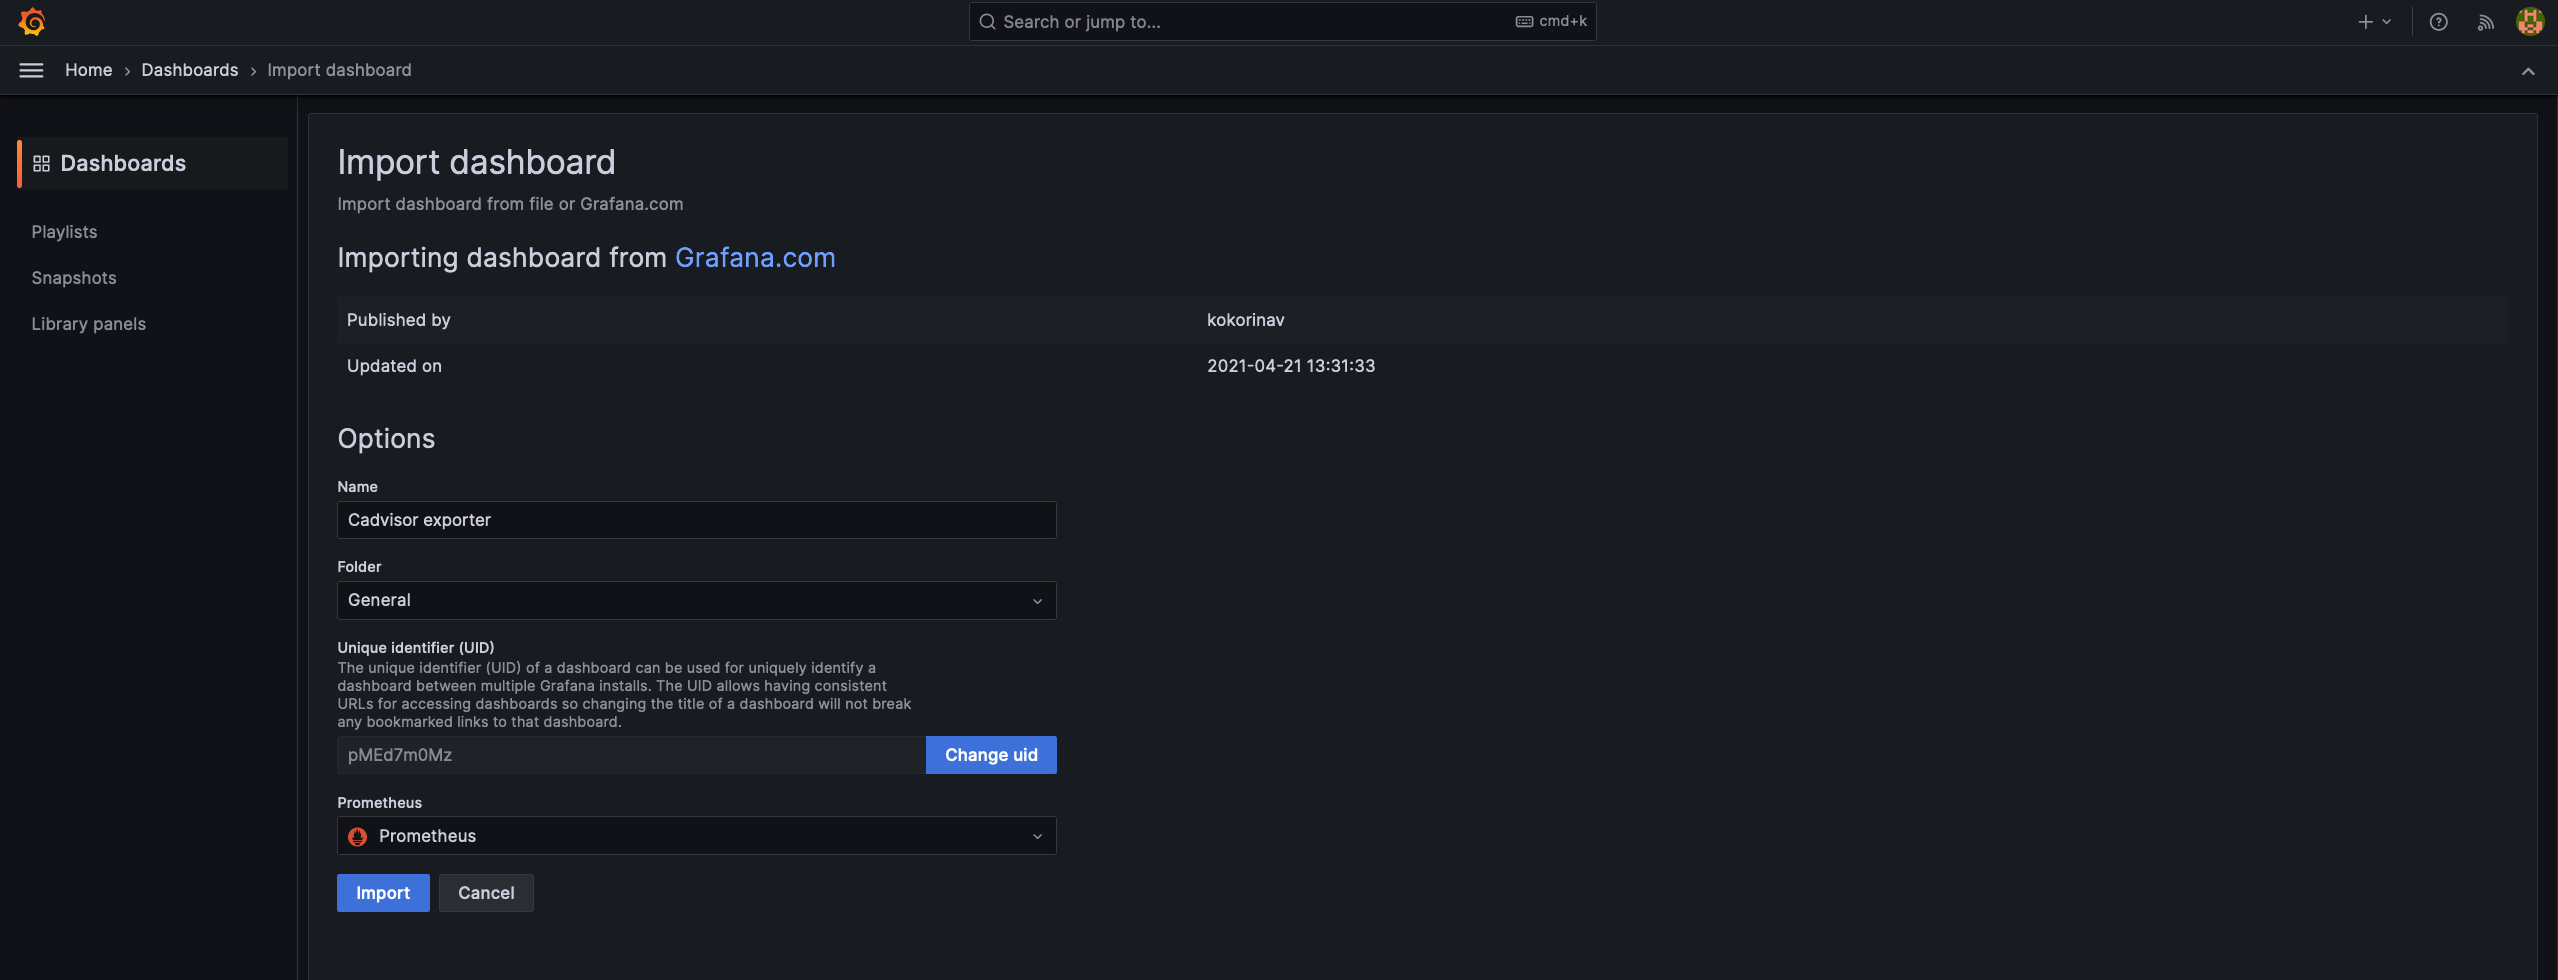
Paste the above ID number in the Grafana "import dashboard" and hit load to create the chosen dashboard in our Grafana app. Select your Prometheus Server and select import.
Step 4: Check the Logs or Docker Container Name on Grafana UI
Go to your Grafana dashboard and check the real-time logs from your Docker containers.

Congratulations! You've successfully sent Docker logs to Grafana, allowing you to monitor your containerized applications in real time. By integrating Docker containers with Grafana, you can gain valuable insights into your application's performance and troubleshoot any issues effectively.
Stay tuned for Day 76 of the #90daysofdevops challenge, where we'll explore how to build a Grafana Dashboard.

