#90DaysOfDevOps Challenge - Day 74 - Connecting EC2 with Grafana

Cloud Engineer and DevOps enthusiast, just talking about AWS, Docker, Linux, Kubernetes, Python, and automation.
Welcome to Day 74 of the #90DaysOfDevOps Challenge. Today, we will explore how to connect Linux and Windows EC2 instances with Grafana, enabling us to monitor various components of the servers. We'll use Grafana, Prometheus, and Node Exporter to achieve this. So, let's dive in!

Grafana: A Powerful Monitoring Tool
Grafana is not just an ordinary monitoring system; it is a feature-rich and highly versatile platform that empowers DevOps engineers to gain deep insights into the performance and health of their systems. With its intuitive and user-friendly interface, Grafana allows you to collect and visualize metrics from various sources effortlessly. Whether you need to monitor server metrics, application performance, or business analytics, Grafana has got you covered.
Prometheus: The Data Scraping Wizard
Prometheus is an exceptional open-source monitoring and alerting toolkit that specializes in handling time-series data like no other. With its unique pull model architecture, Prometheus can seamlessly scrape metrics from a wide range of targets, including the Node Exporter running on our EC2 instances. Its ability to scale and handle massive amounts of data while maintaining exceptional performance sets it apart as a true data scraping wizard.
Node Exporter: Metrics for Our EC2 Instances

Node Exporter acts as a dedicated Prometheus exporter, gathering crucial system-level metrics from our Linux EC2 instances. This powerful tool enables us to capture essential performance indicators such as CPU usage, memory consumption, disk space utilization, and network statistics. By harnessing Node Exporter's capabilities, we can comprehensively monitor the health and resource utilization of our EC2 instances, ensuring they operate at peak efficiency and performance levels.
Task: Connecting EC2 Instances with Grafana
Now that we have a brief overview of the tools we'll be using, let's go ahead and connect our Linux EC2 instances with Grafana. We'll follow these steps:
Install Grafana and Prometheus on an EC2 Instance:
Launch a new EC2 instance with Ubuntu or any other supported Linux distribution.

Use the below shell script to install docker and ensure you can follow the next steps. This is applicable to all the instances we'll use today.
  #!/bin/bash

  # Update package lists
  sudo apt update

  # Install required packages to use repositories over HTTPS
  sudo apt install -y apt-transport-https ca-certificates curl software-properties-common

  # Add Docker repository GPG key
  curl -fsSL https://download.docker.com/linux/ubuntu/gpg | sudo gpg --dearmor -o /usr/share/keyrings/docker-archive-keyring.gpg

  # Add Docker repository
  echo "deb [arch=amd64 signed-by=/usr/share/keyrings/docker-archive-keyring.gpg] https://download.docker.com/linux/ubuntu $(lsb_release -cs) stable" | sudo tee /etc/apt/sources.list.d/docker.list > /dev/null

  # Update package lists again with the Docker repository
  sudo apt update

  # Install Docker
  sudo apt install -y docker-ce docker-ce-cli containerd.io

  # Start Docker
  sudo systemctl start docker

  # Enable Docker to start on boot
  sudo systemctl enable docker

  # Add $USER to the docker group
  sudo usermod -aG docker $USER

  # Restart system to apply the changes
  sudo reboot
SSH into the EC2 instance and install Grafana using the Official Documentation for your OS. In my case, I will use Docker Compose. I'll also follow the Prometheus Official Documentation to instal
  ---
  version: '3'
  volumes:
    prometheus-data:
      driver: local
    grafana-data:
      driver: local

  services:

    grafana:
      image: grafana/grafana-oss:latest
      container_name: grafana
      ports:
        - "3000:3000"
      volumes:
        - grafana-data:/var/lib/grafana
      restart: unless-stopped

    prometheus:
      image: prom/prometheus:latest
      container_name: prometheus
      ports:
        - 9090:9090
      volumes:
        - /etc/prometheus:/etc/prometheus
        - prometheus-data:/prometheus
      command: "--config.file=/etc/prometheus/prometheus.yml"
      restart: unless-stopped
Run
docker compose up -dto start the services
Install Node Exporter:
On the same Linux EC2 instance (Instance-A), install Node Exporter to collect system-level metrics. For that, I'll amend the previous docker-compose.yml file with the below changes to include the node exporter container:
  ---
  version: '3'
  volumes:
    prometheus-data:
      driver: local
    grafana-data:
      driver: local

  services:

    grafana:
      image: grafana/grafana-oss:latest
      container_name: grafana
      ports:
        - "3000:3000"
      volumes:
        - grafana-data:/var/lib/grafana
      restart: unless-stopped

    prometheus:
      image: prom/prometheus:latest
      container_name: prometheus
      ports:
        - 9090:9090
      volumes:
        - /etc/prometheus:/etc/prometheus
        - prometheus-data:/prometheus
      command: "--config.file=/etc/prometheus/prometheus.yml"
      restart: unless-stopped

    node_exporter:
      image: quay.io/prometheus/node-exporter:latest
      container_name: node_exporter
      command:
        - '--path.rootfs=/host'
      network_mode: host
      pid: host
      restart: unless-stopped
      volumes:
        - '/:/host:ro,rslave'
Launch another Linux EC2 instance (Instance-B) and use the below docker-compose.yml file to run node exporter.

  ---
  version: '3'

  services:

    node_exporter:
      image: quay.io/prometheus/node-exporter:latest
      container_name: node_exporter
      command:
        - '--path.rootfs=/host'
      network_mode: host
      pid: host
      restart: unless-stopped
      volumes:
        - '/:/host:ro,rslave'
Run
docker-compose up -danddocker psto ensure the Docker container is running
Configure Prometheus to Scrape Metrics:
On Instance-A, edit the Prometheus configuration file
prometheus.ymlto include the scraping targets for both Node Exporter instances (Instance-A and Instance-B) and save them in/etc/prometheus(create the directory if necessary).global: scrape_interval: 15s # By default, scrape targets every 15 seconds. # Attach these labels to any time series or alerts when communicating with # external systems (federation, remote storage, Alertmanager). # external_labels: # monitor: 'codelab-monitor' # A scrape configuration containing exactly one endpoint to scrape: # Here it's Prometheus itself. scrape_configs: # The job name is added as a label `job=<job_name>` to any timeseries scraped from this config. - job_name: 'prometheus' # Override the global default and scrape targets from this job every 5 seconds. scrape_interval: 5s static_configs: - targets: ['172.31.0.36:9090'] # Example job for node_exporter - job_name: 'node_exporter' static_configs: - targets: ['172.31.0.58:9100', '172.31.0.36:9100'] # Example job for cadvisor # - job_name: 'cadvisor' # static_configs: # - targets: ['cadvisor:8080']Restart the Prometheus service to apply the changes.

Copy the public IP address of the instance where Prometheus is installed and paste it into the browser using port 9090 to verify Prometheus can connect to the target nodes.

Create a Grafana Dashboard:
Access the Grafana web interface by opening your browser and entering the public IP or DNS of the Grafana EC2 instance and port 3000
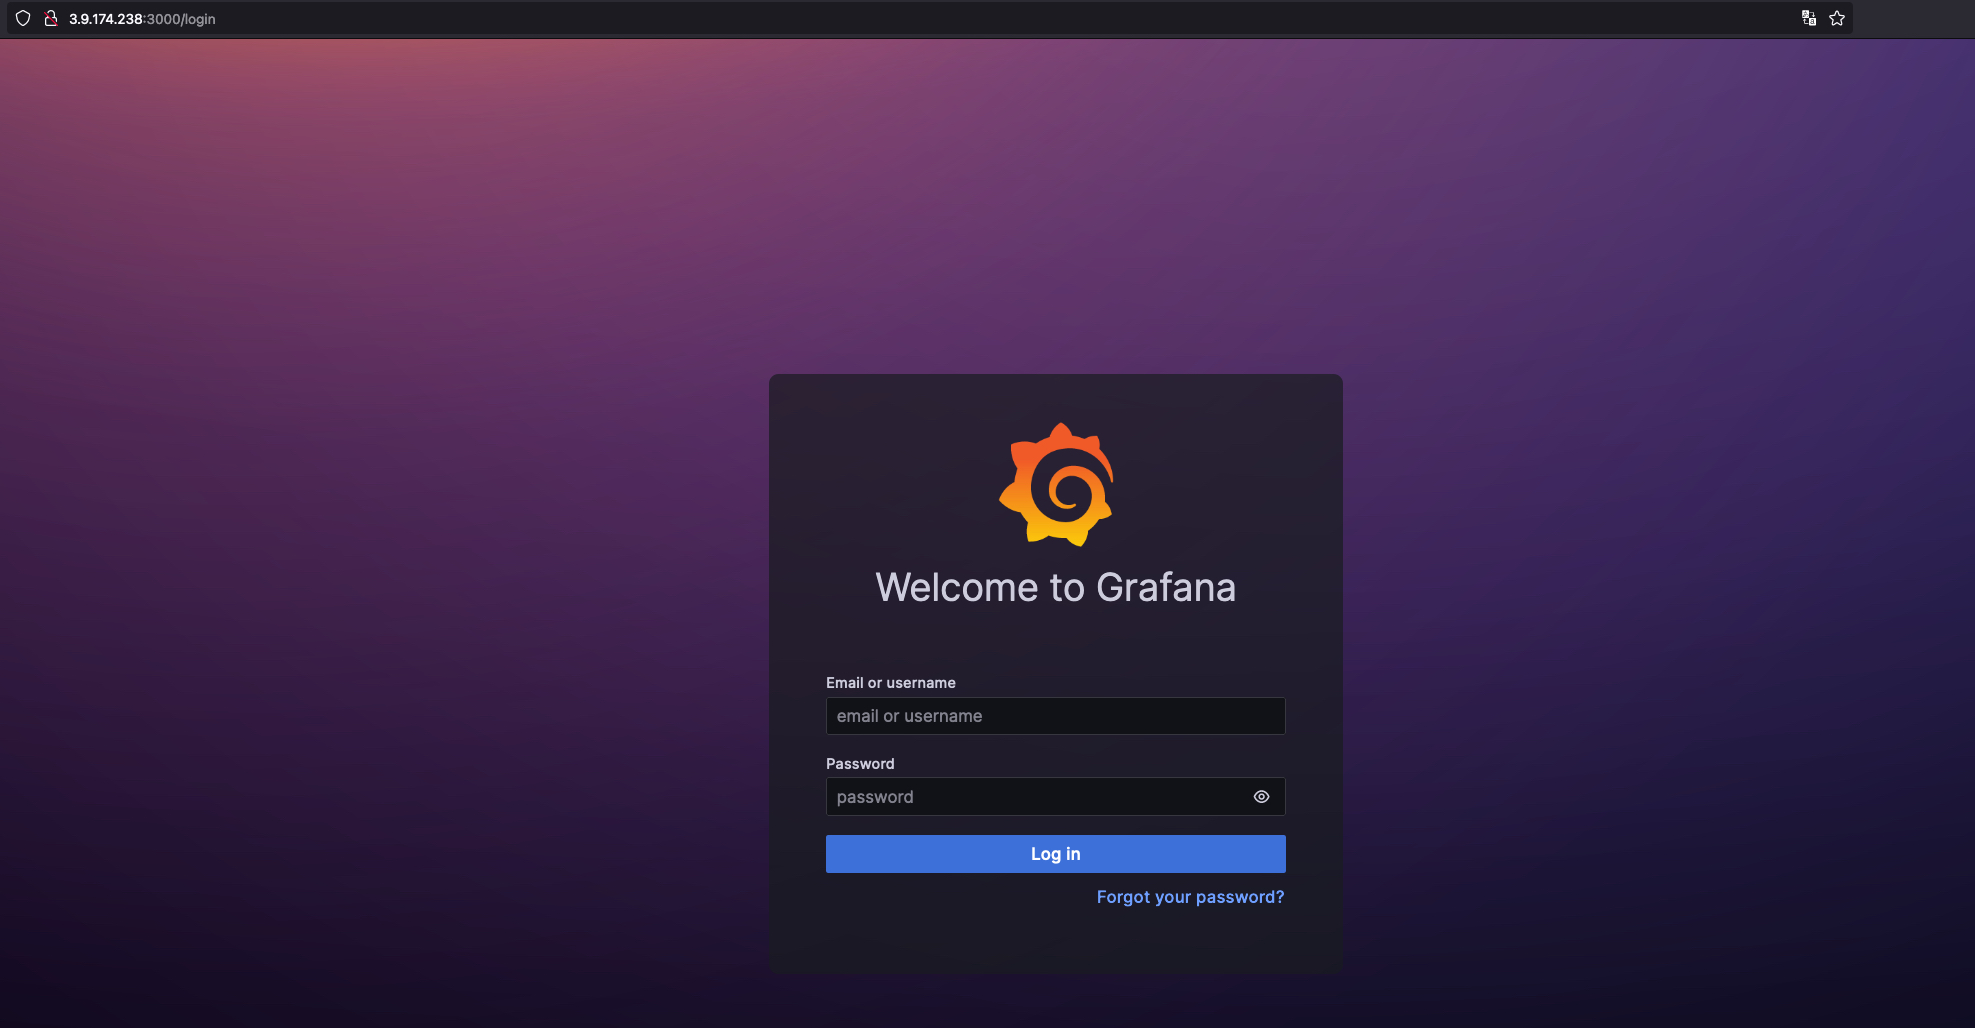
Log in to Grafana using the default credentials (admin:admin) and change the password.
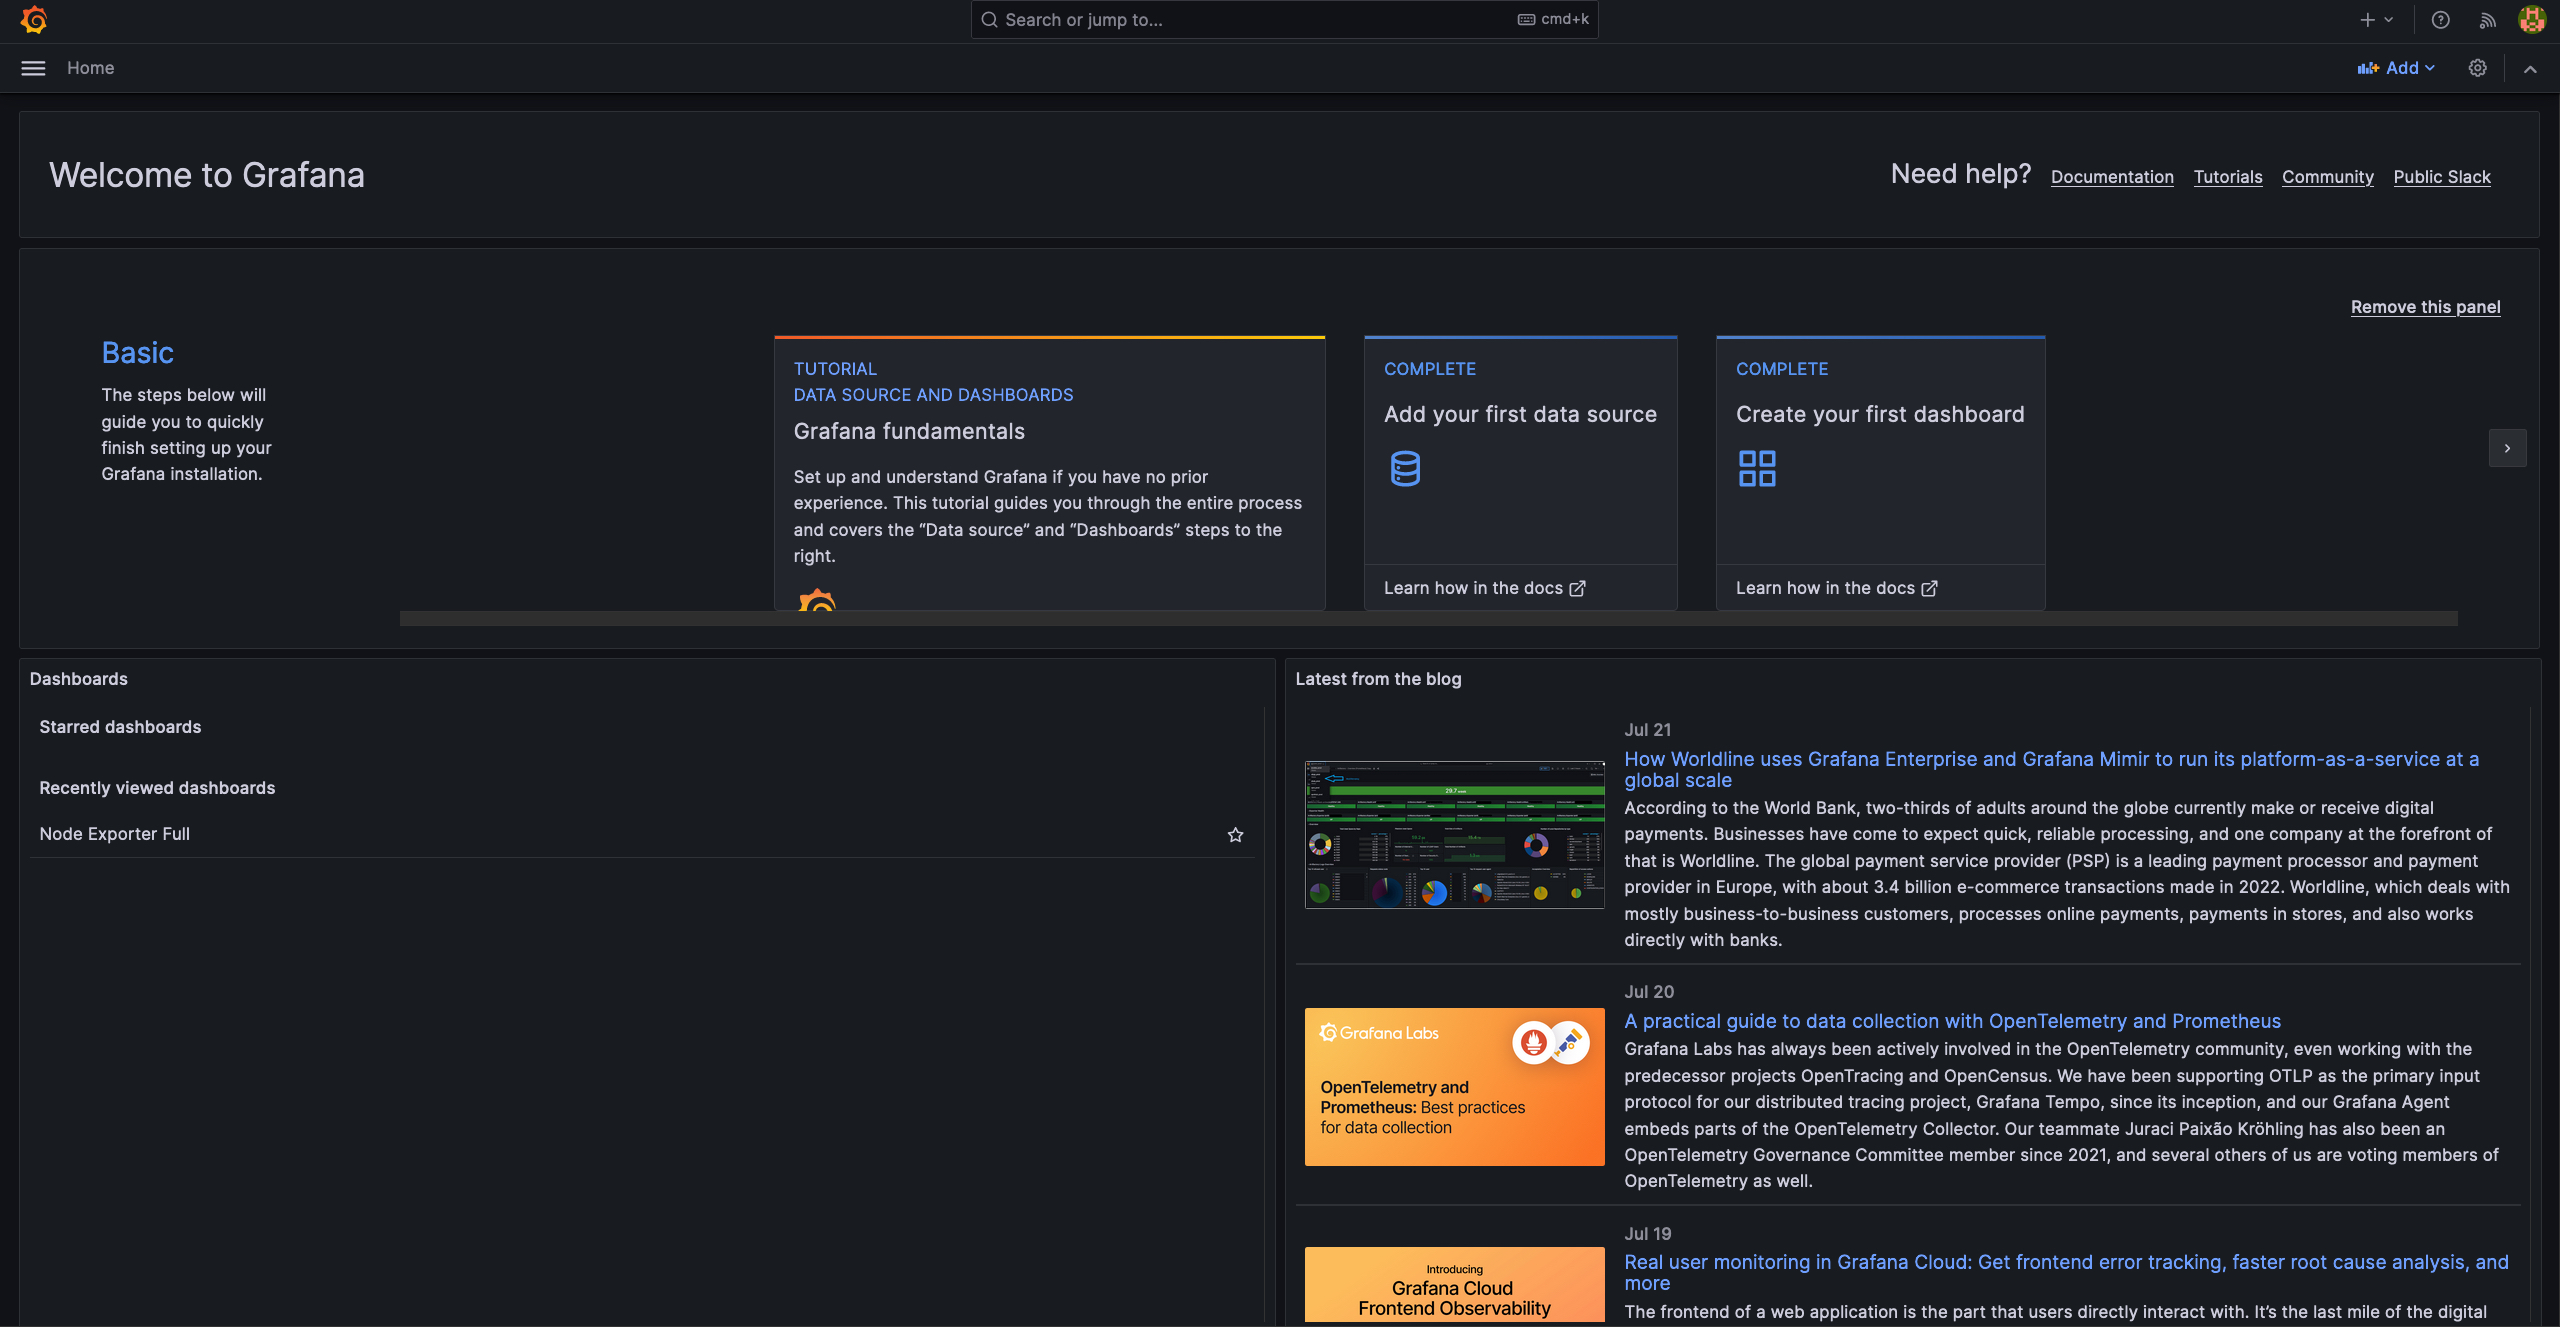
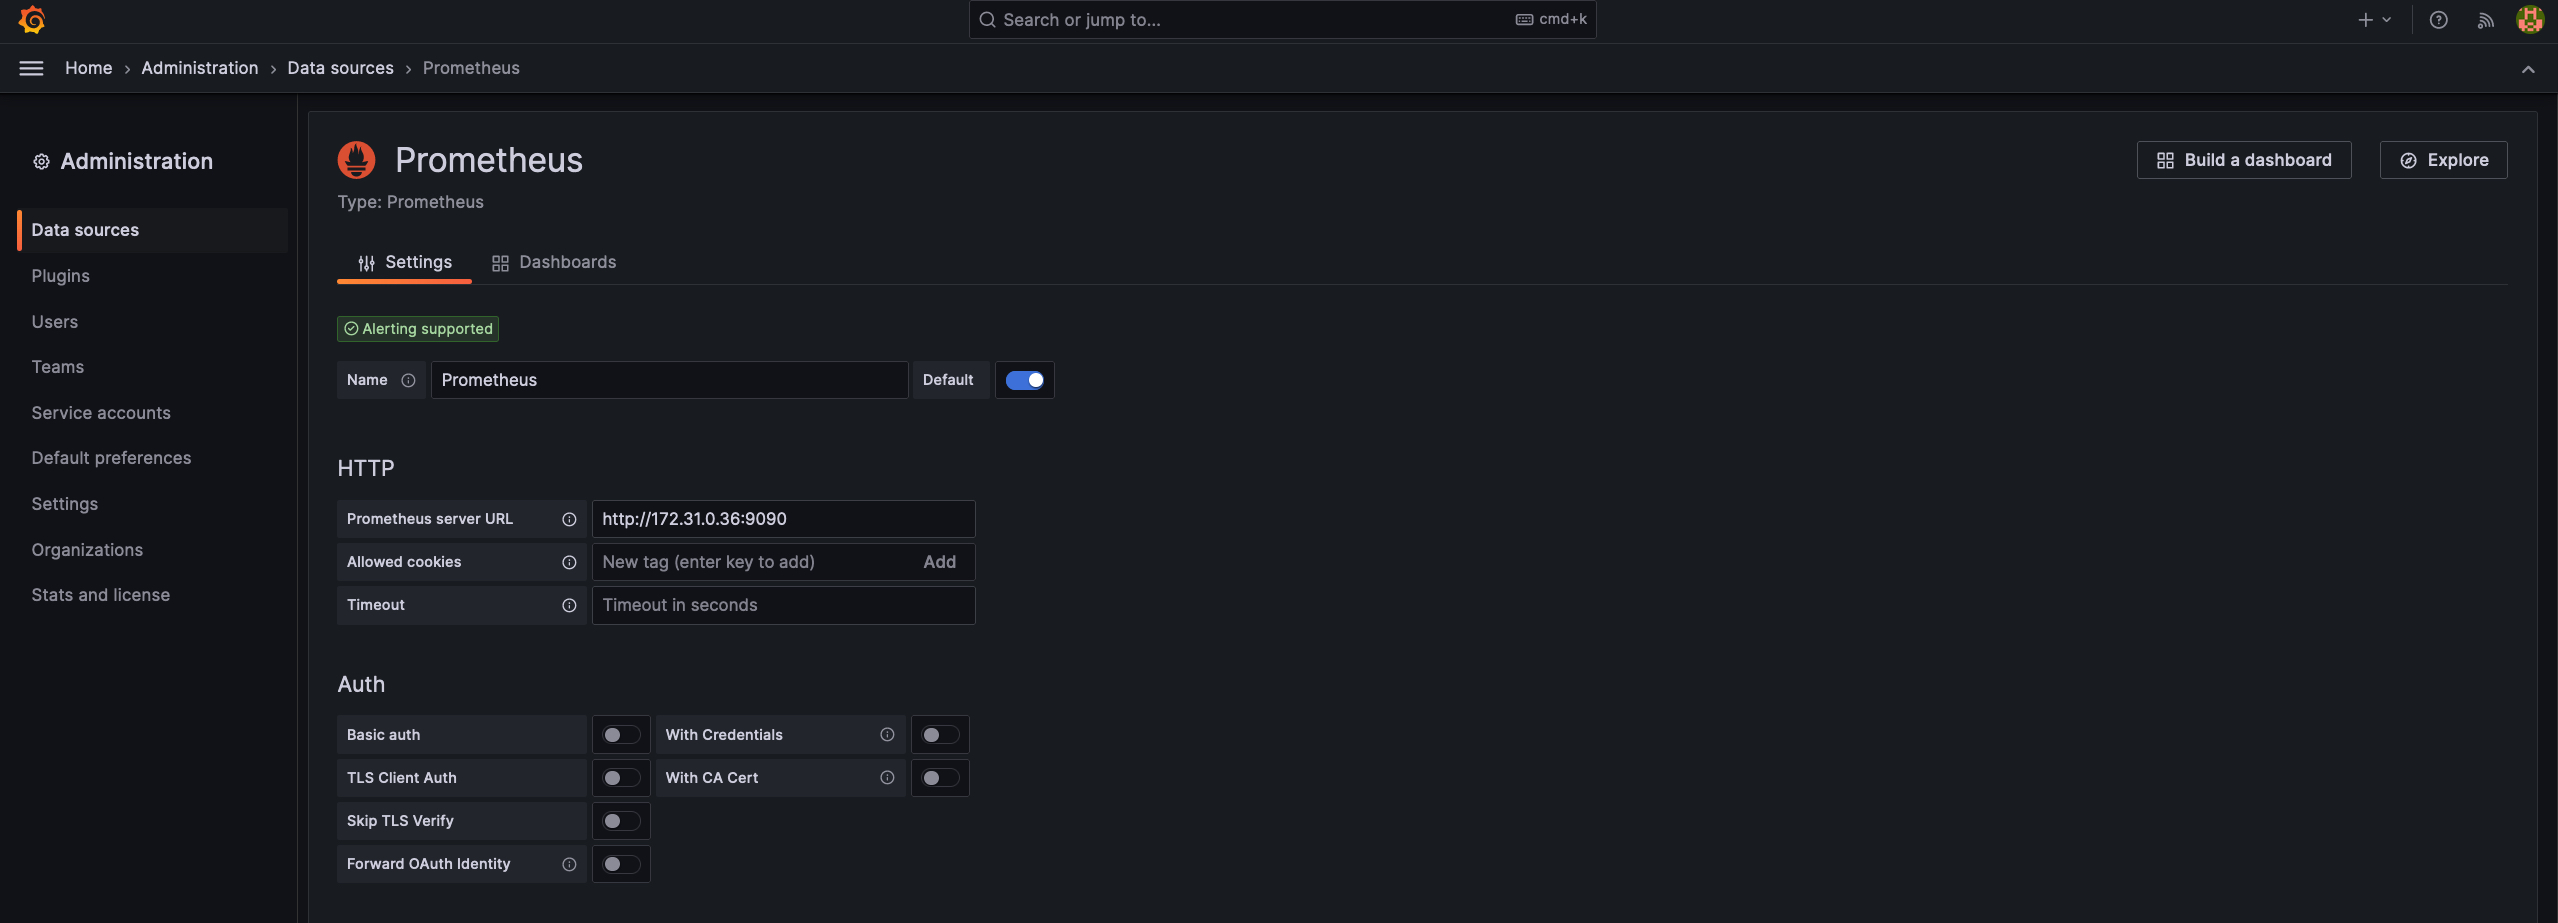
Add Prometheus as a data source in Grafana, using the Prometheus EC2 instance's IP address.
Create a new dashboard in Grafana and add panels to visualize different metrics collected by Node Exporter.

Congratulations! You've successfully connected Linux EC2 instances with Grafana and created a dashboard to monitor their performance metrics. Monitoring is a crucial aspect of any DevOps practice, and Grafana along with Prometheus and Node Exporter provides a powerful combination to gain insights into the health of your infrastructure.
Stay tuned for the Day 75, where we'll explore how to send Docker logs to Grafana!

