#90DaysOfDevOps Challenge - Day 78 - Monitoring with Grafana Cloud
Cloud Engineer and DevOps enthusiast, just talking about AWS, Docker, Linux, Kubernetes, Python, and automation.
Welcome back to the #90DaysOfDevOps Challenge. On Day 78, we'll explore the powerful capabilities of Grafana Cloud for monitoring your infrastructure and cloud resources. Grafana Cloud offers a comprehensive monitoring solution that allows you to gain valuable insights into the performance and health of your systems. Let's dive in and learn how to set up alerts for EC2 instances and AWS Billing Alerts using Grafana Cloud.
Grafana Cloud: A Comprehensive Monitoring Solution
Grafana Cloud is a robust and scalable monitoring platform that provides a wide range of monitoring capabilities for your infrastructure, applications, and cloud resources. With Grafana Cloud, you can consolidate all your monitoring needs into a single platform, allowing you to gain real-time visibility into the performance and health of your systems. The platform's intuitive interface and powerful features make it an ideal choice for DevOps teams to effectively monitor their environments.
Task: Setting Up Alerts for EC2 Instances and AWS Billing Alerts
Step 1: Create an EC2 Instance - Start by creating an EC2 instance in your AWS environment. This instance will be monitored using Grafana.

Step 2: Set up Grafana Cloud Console - If you haven't set up Grafana Cloud yet, follow the steps in my previous blog post on how to set up Grafana Cloud.

Step 3: Connect Data to AWS
On the Grafana Cloud home page, navigate to the "Connections/Add new connection" section.
Click on "AWS" to access the setup for AWS account integration.

Step 4: Select CloudWatch Metrics
- In the dashboard, select CloudWatch metrics for integration between AWS and Grafana Cloud.

Step 5: Create AWS IAM Role - For CloudWatch integration, you need to create an AWS IAM Role. Follow the given steps in the screenshot to set up the IAM Role via CloudFormation.


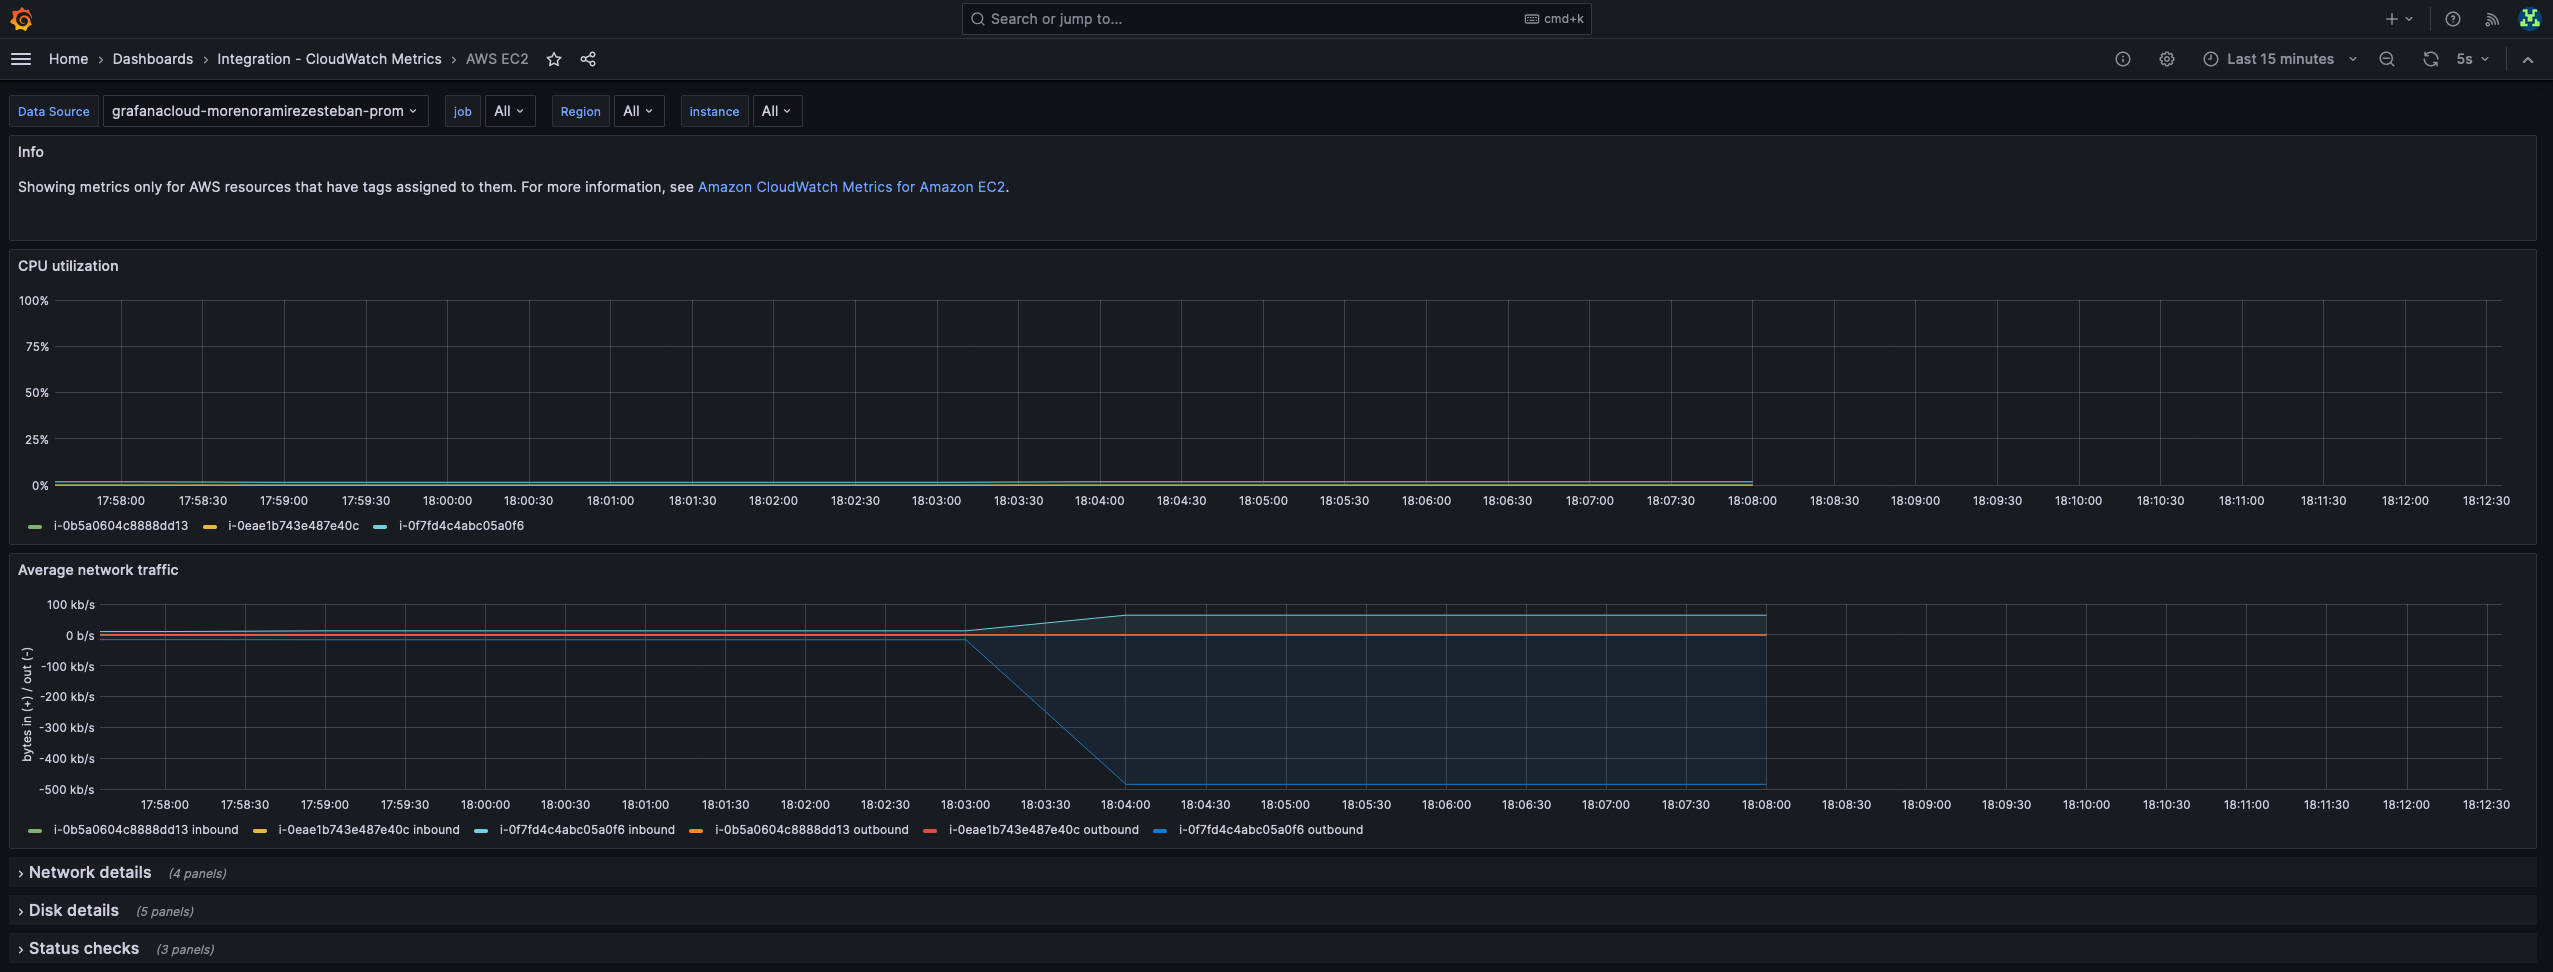
Step 6: Access CloudWatch Metrics Dashboard - After successful integration, go to the home page and open the dashboard. Select the CloudWatch Metrics dashboard to view visualized data with real-time tracking.
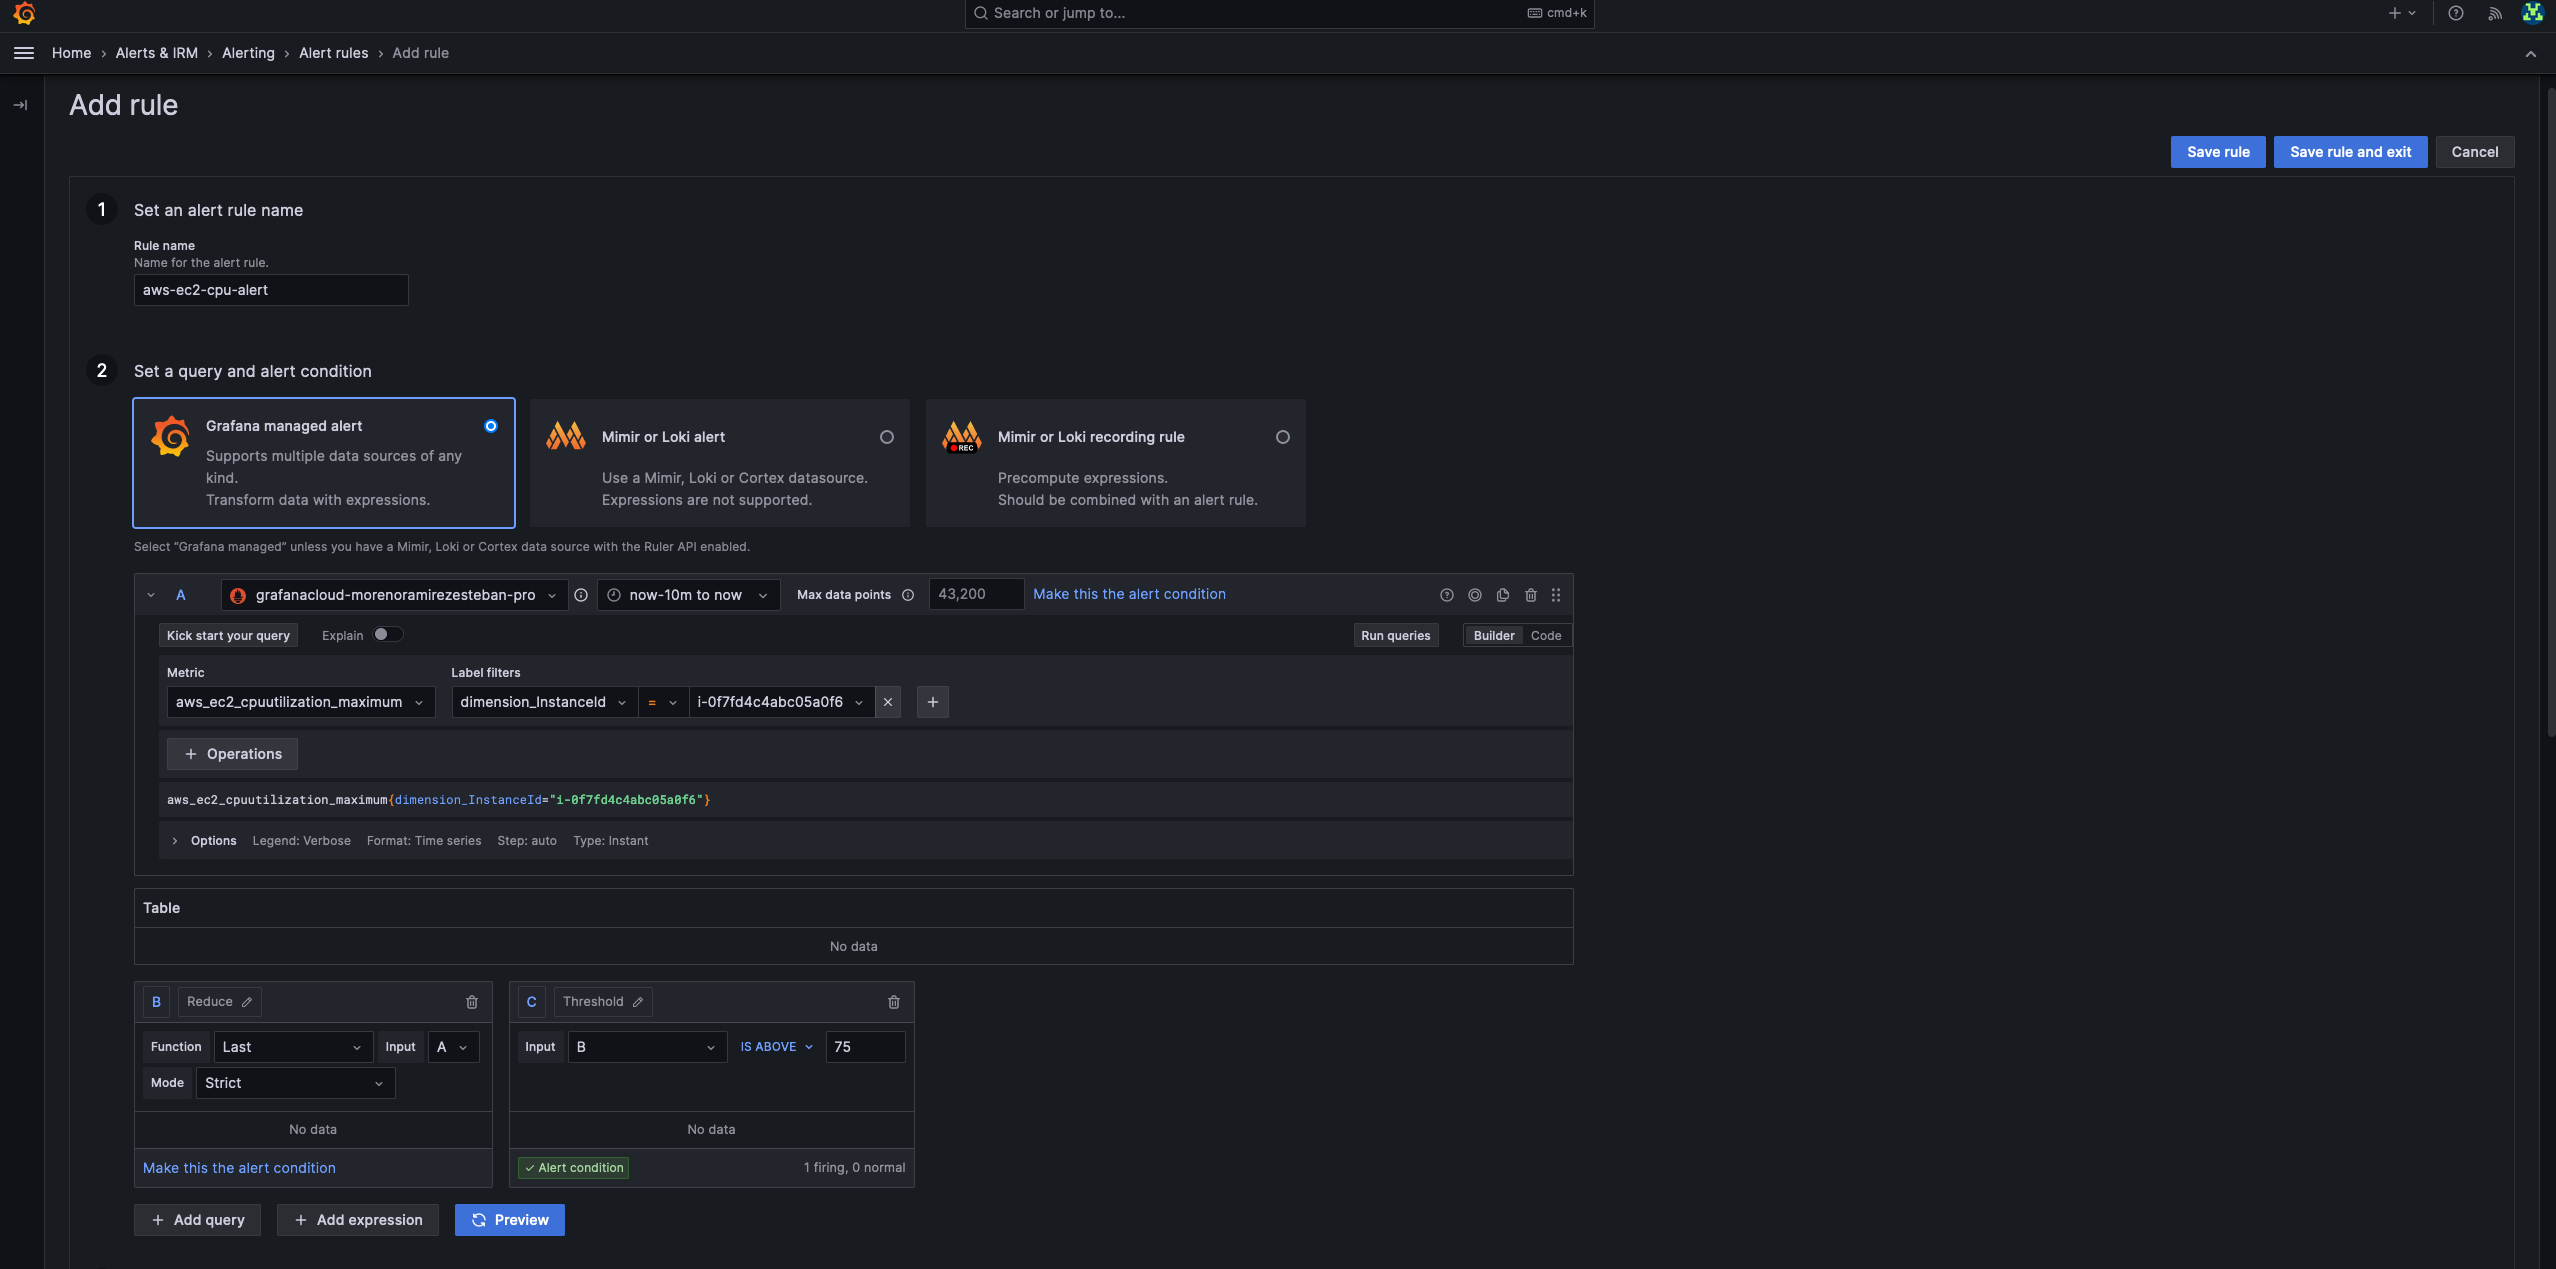
Step 7: Set Up Alerts for CPU Utilization - Now we will set up an alert for CPU utilization when it reaches 75%.
Click on "Create Alert Rule" for CPU utilization above 75%.
Select the metric
as_ec2_cpuutilization_maximum, then select the instance ID, and set the threshold value to 75%.Run the query to check the output.
Click "Save Rule" to save the alert rule.
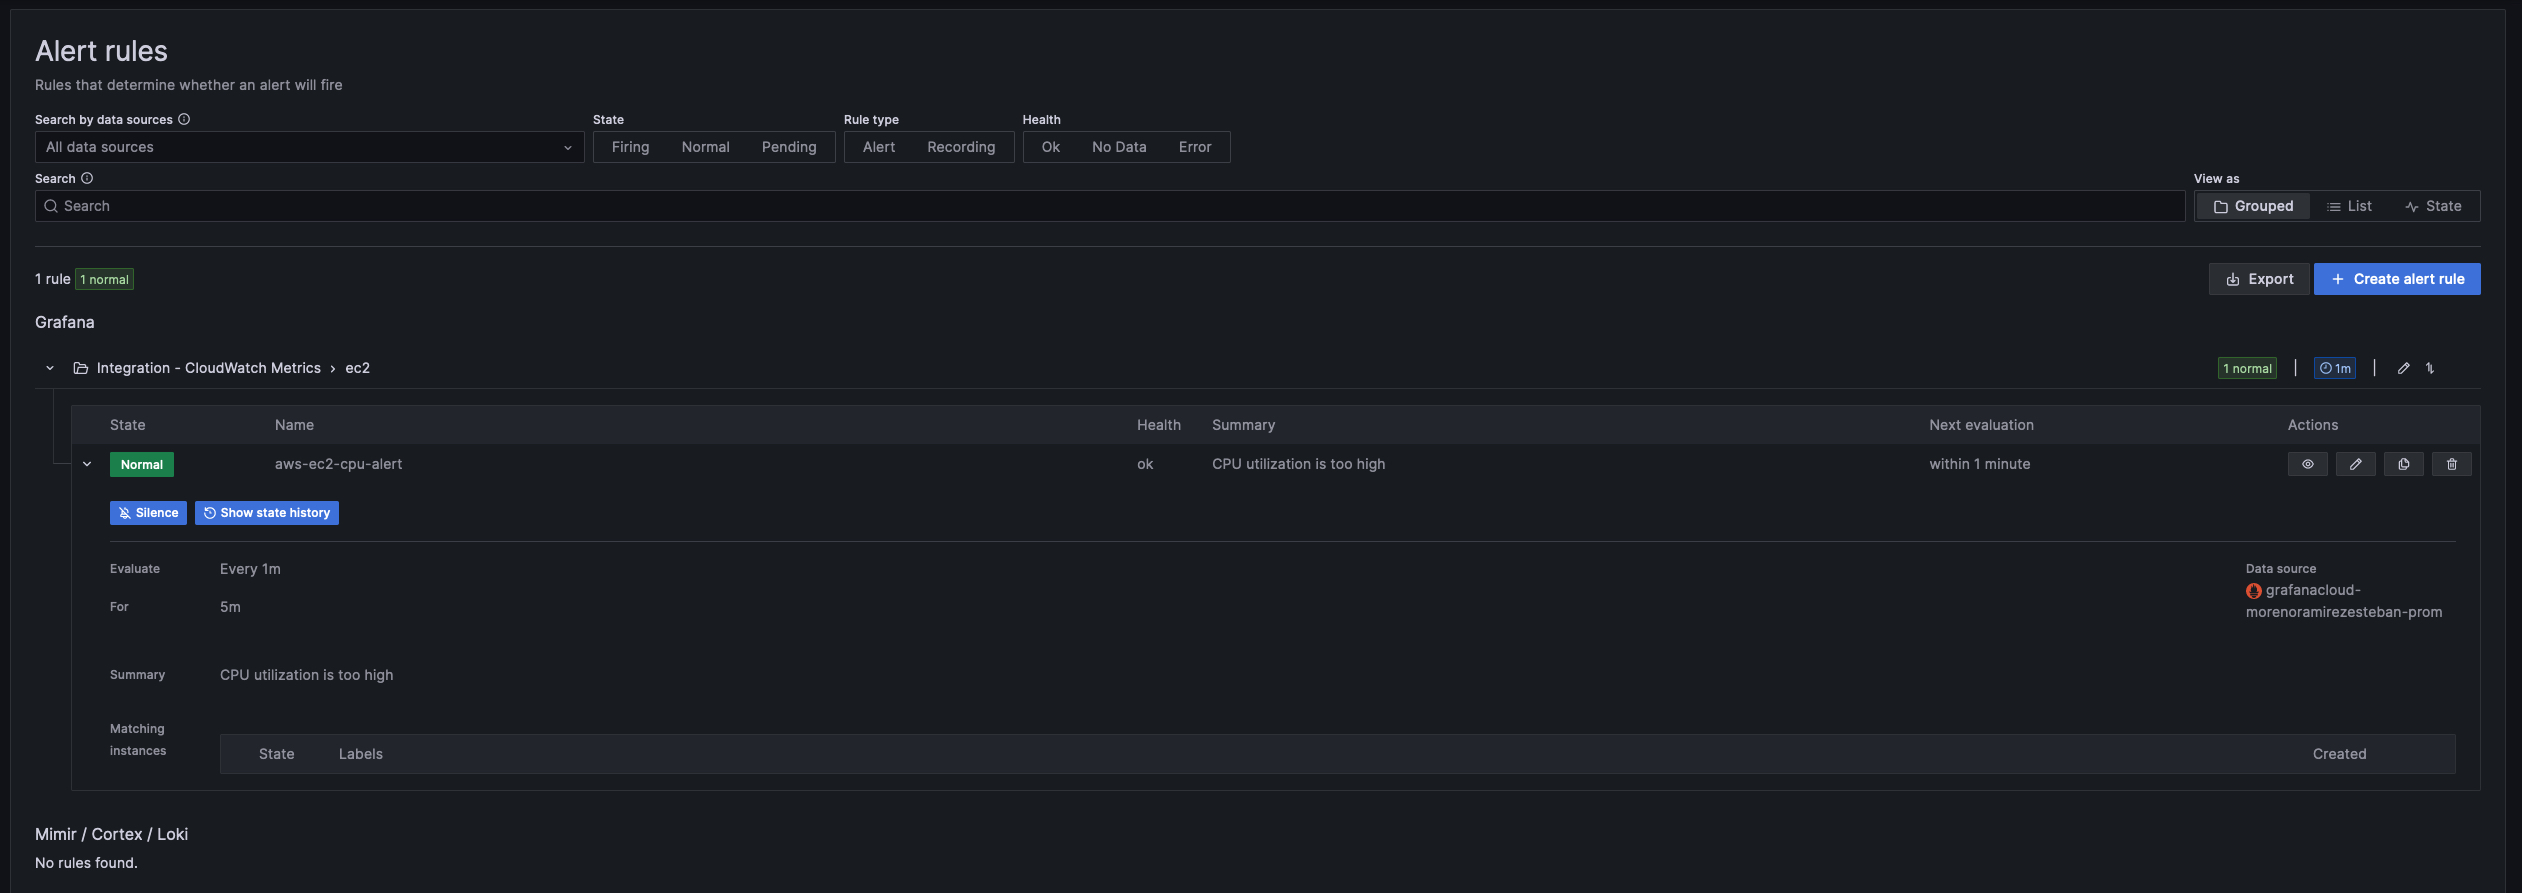
Step 8: Configure Alerting Emails - To receive alert notifications via email, follow these steps:
Click on "Manage Contact Points."
Edit the
grafana-default-emailcontact point.
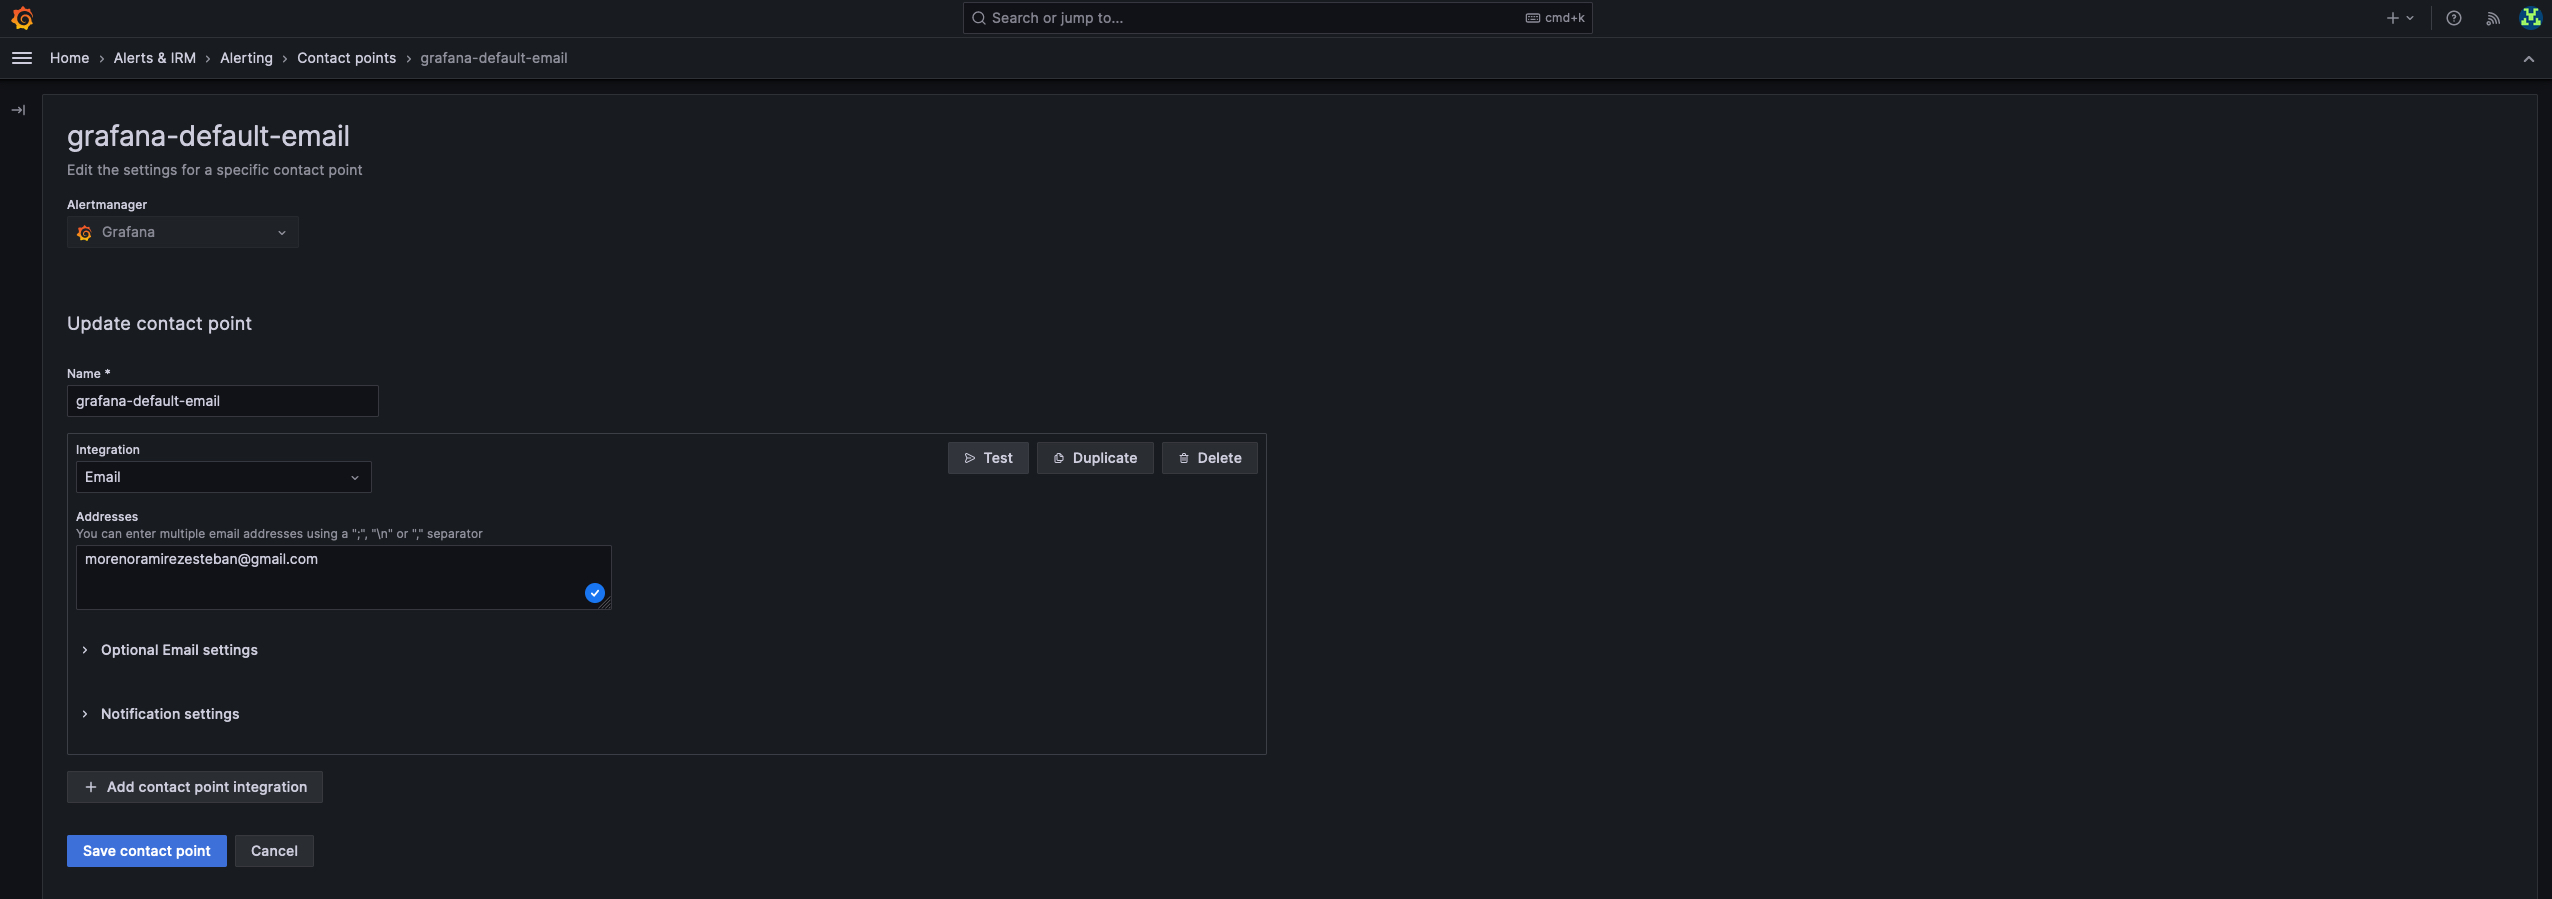
Put your email address in the "Address" field and click "Test" for verification.
You will receive a test alert email to confirm the setup.

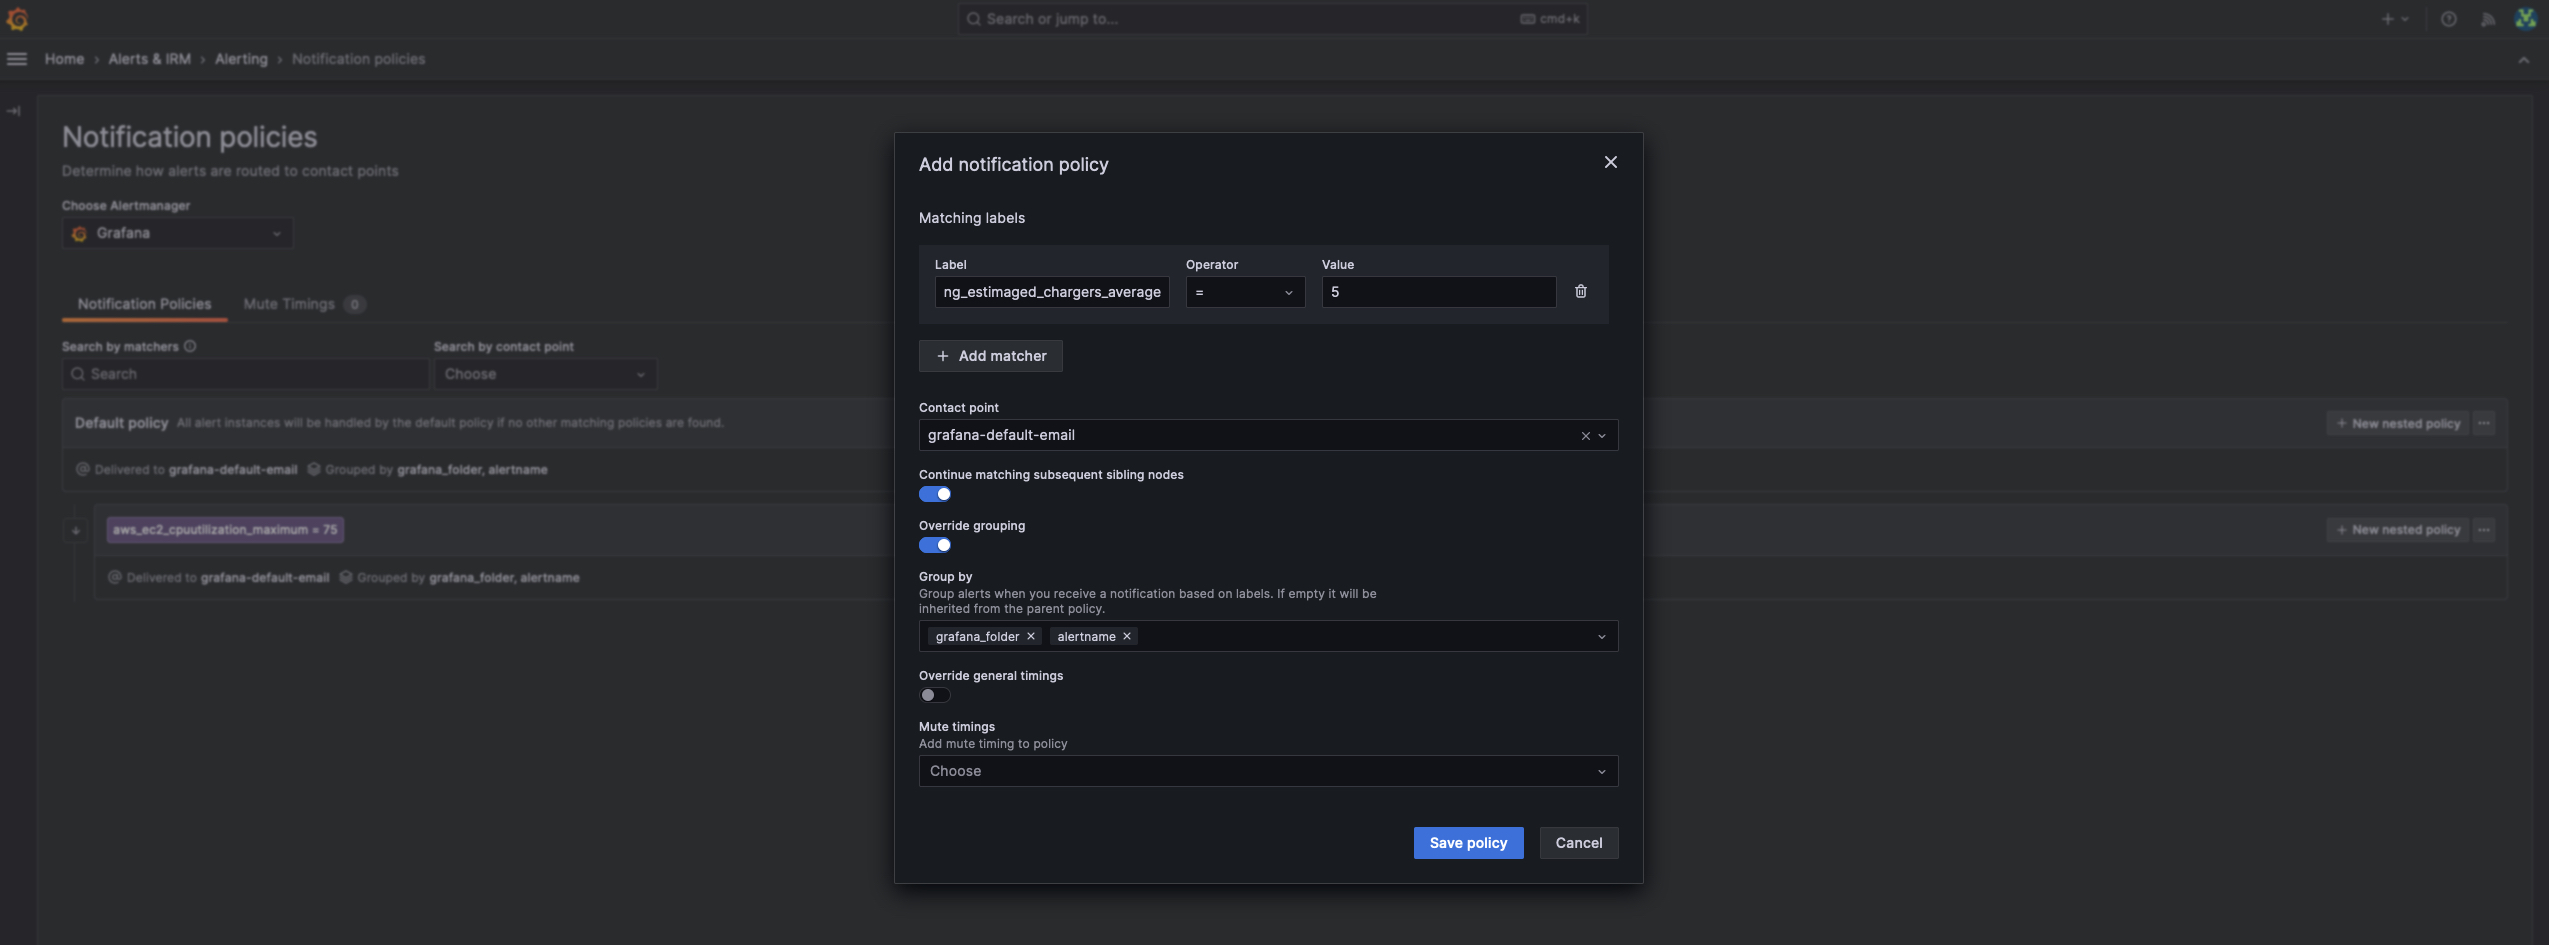
Step 9: Set Up Notification Policies
Click on "Manage Notification Policies."
Select the label and value for the notification (e.g., "alert" and "critical").
Choose the contact point you previously created for alerting emails.
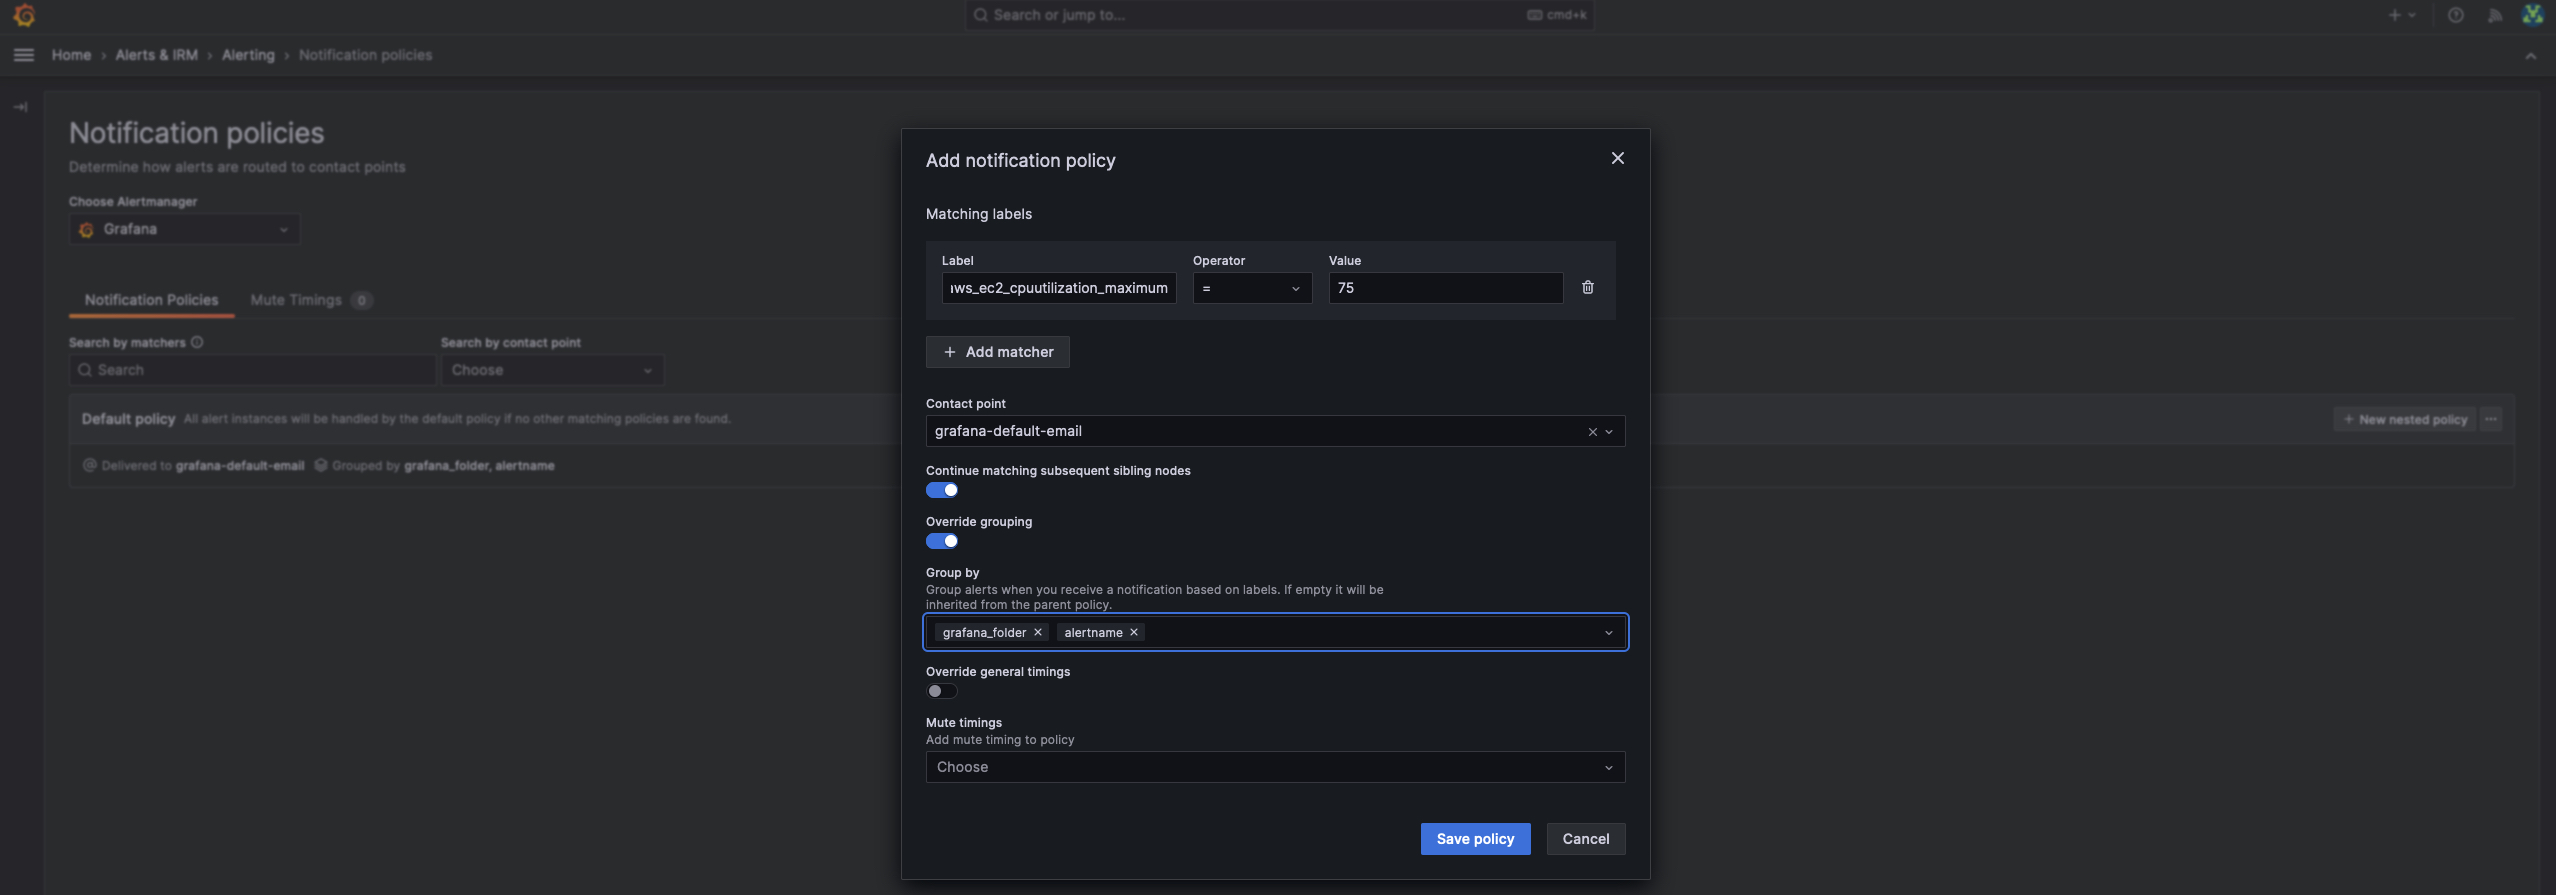
Step 10: Set Up Alerts for Billing In this step, we will set up an alert to avoid overspending on AWS services. We'll create an alert if the estimated billing charges go above $10.
Select "Manage Alert Rule."
Choose the metric
aws_billing_estimated_charges_averageand sum them.Set the threshold value to 5$.
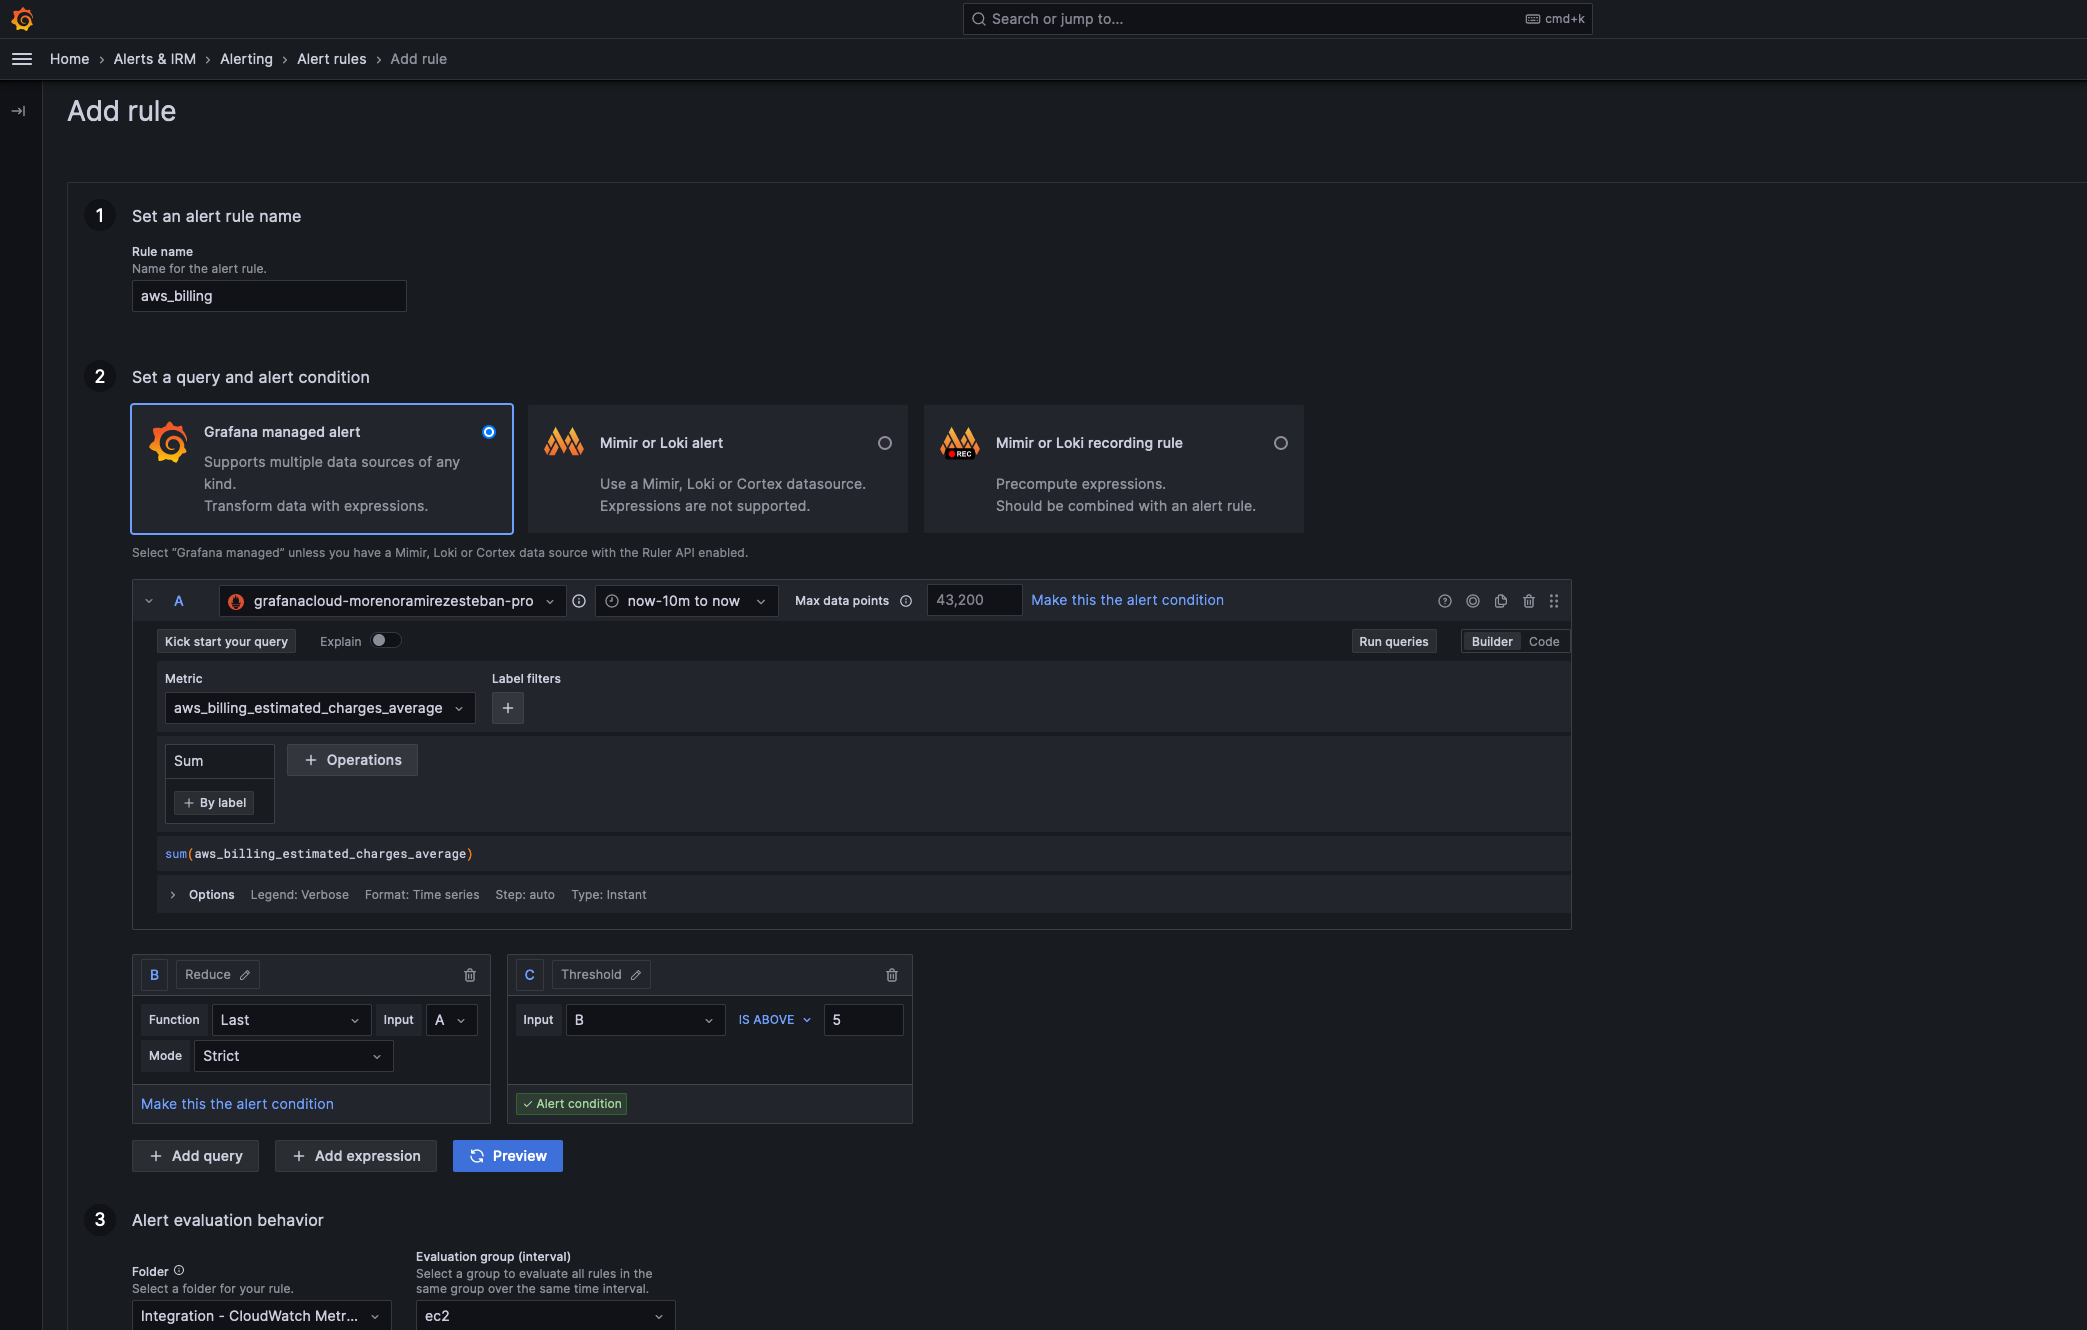
- Add a new notification policy for billing above $5.
Congratulations! You've now set up monitoring and alerting for your EC2 instances and AWS billing in Grafana Cloud. With Grafana Cloud's powerful monitoring capabilities, you can proactively respond to issues and ensure the optimal performance of your infrastructure.
Stay tuned for Day 79 of the #90daysofdevops challenge, where we'll explore Prometheus!

